
~/gklab
├── Template Collab Letter.docx
├── admin
├── advice-on-running-labs
├── coffee-expt-design.R
├── gaurav
├── lab-guidebook
├── lab-manual
├── lab-pics
├── lab-website
├── lsu_generic_budget_justification_01-2024.docx
├── lsugenericbudget_1_24.xlsx
├── mentees
├── misc
├── nsf1030_1-24_.xlsx
├── pdfs
├── research
├── teaching
└── templatesEmancipation Oak at Hampton University, Virginia
Computing in ecology and evolutionary biology
Gaurav Kandlikar
slides: https://talks.gklab.org/lagniappebootcamp-25
Rate yourself from 1 to 10 on this scale:


How many days a week do you use the following tools?
- R (or RStudio)
- Python
- Bash scripting (or programs called from command line)
- Other programming language (Julia, Matlab, …)
- High-performance computing (HPC)
- Regular expressions
- Git or other version control
Installation
Everyone should have the following programs installed:
- R (Version 4.4.3)
- RStudio
- Git
- GitBash (if on Windows)
Today’s lesson plan
- Data management 101 (~40 minutes)
- Project organization and management (~40 minutes)
- Writing with quarto-markdown (~40 minutes)
- Version control with Git (~40 minutes) OR Publication-ready graphics with ggplot (~40 minutes)
Acknowledgements
Much of the material in this workshop comes from Data Carpentry or Software Carpentry
All of the material in this workshop builds on open-source contributions to the computing ecosystem, thanks to people around the world.
Data management 101
Data audit
- What are the different sources of data in your project? (This means, in how many places are data collected that are relevant to your project?)
- What are the different types of data in your project? (e.g. Climate data, genome sequences, abundance data, traits, etc.)
- At this moment, where are all the data stored? What is their organizational structure?
- At this moment, in what ways are the data backed up?
- At this moment, how much “meta-data” exists to explain your data to a collaborator or an external evaluator?
Principles of data organization
Data should be easily understood by you, collaborators, evaluators (e.g. reviewers), and computers
Sometimes, organizational strategies that work well for humans don’t work well for computers
Develop good practices that make data legible to both humans and computers
Keep your raw data raw! Make copies for cleaning.
Spreadsheet management
- Almost everyone will manage data in a spreadsheet format
- Remember that the spreadsheet is not a lab notebook
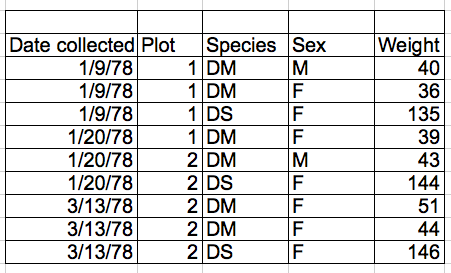
- Data on spreadsheets should have a “rectangular” format: rows and columns only
- Avoid encoding information by color or in margin text
- Columns for variables; rows for observations
- Leave no cell blank – develop a explicit mechanism for NA/blank/unmeasured values
Exercise
In today’s workshop we will be using the Portal Project Teaching Dataset
This comes from a longrunning study in Arizona regarding rodent and ant impacts on plant communities
- 40 year study, used in >100 publications to date!
Exercise
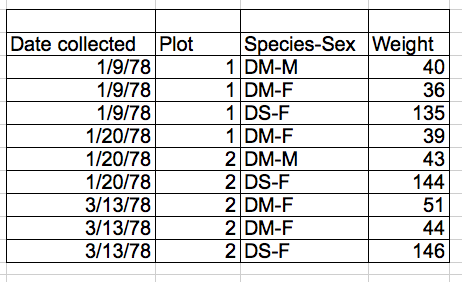
Let’s take a look at a “messy” version of a dataset that might be collected for a project like this.
Our dataset has two tabs. Two field assistants conducted the surveys, one in 2013 and one in 2014, and they both kept track of the data in their own way in tabs 2013 and 2014 of the dataset, respectively. Now you’re the person in charge of this project and you want to be able to start analyzing the data.
Your challenge: With a partner, look through this Google sheet and identify what problems you will have to address to create a “flat” sheet ready for analysis.
Make a copy of the sheet and start addressing issues
Work on this for ~10-15 minutes
Check-in
- What are some improper practices you noticed?
- How did you fix them?
Data management summary
- Good research starts with good data management
- Keep data rectangular
- Try to work with “flat” data files as much as possible (
csv,tsvs, etc.) - Keep raw data raw
- Data should be readable by humans and by computers. (If there is conflict, keep the data readable by computers and include a README for humans)
Project organization and management
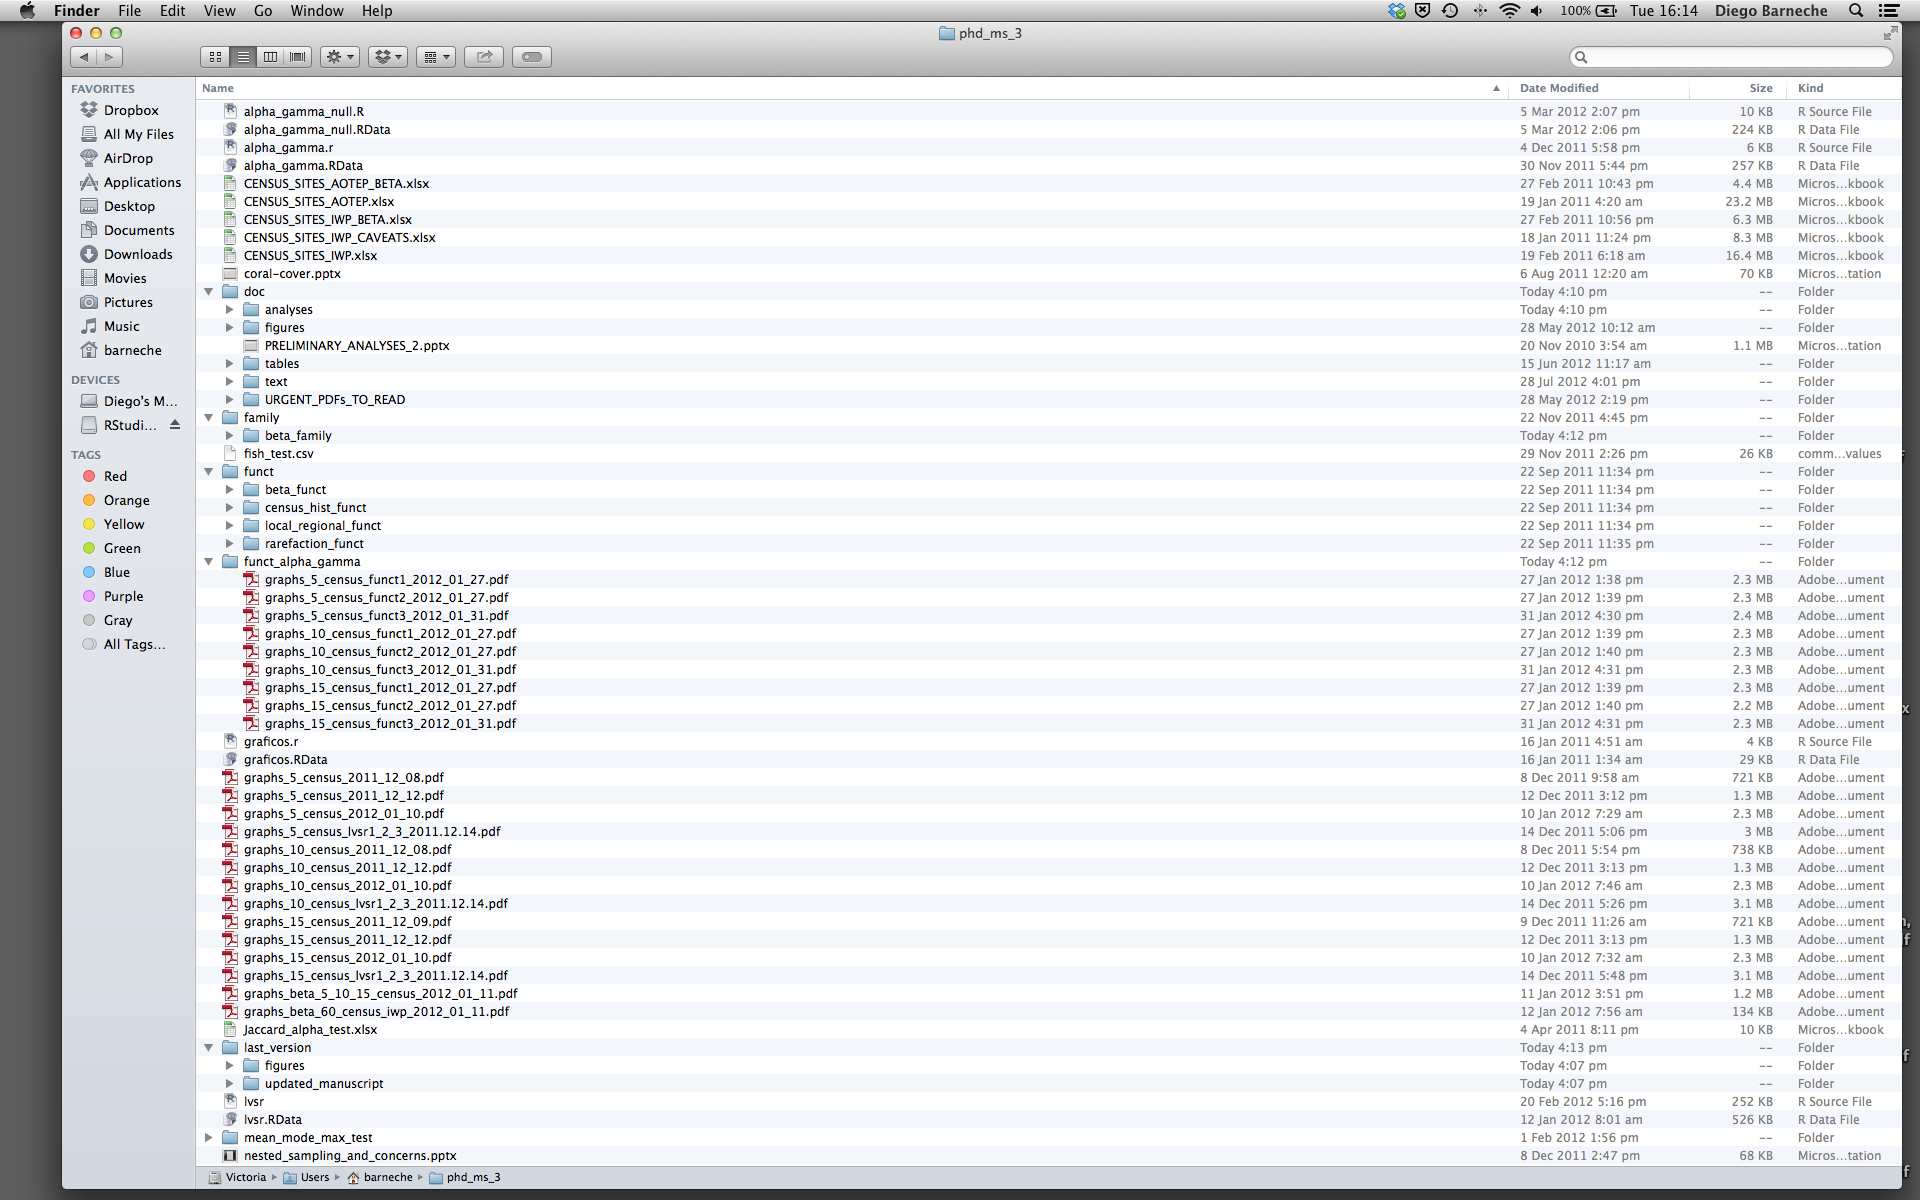
Start thinking in “nested hierarchies”
Alternative to viewing directory structures
~/gklab/research
├── CfoC
├── Coastal_Prairie Data SWG(1).zip
├── b-rapa-drought
├── caring
├── coastalprairie
├── coffee-culture
├── dragnet
├── dragnet.zip
├── fastplants-drought
├── grants
├── julia-test
├── other-projects
├── papers
├── pedagogy
├── peer-review
├── primer-soilmicrobes
├── qcb-survey
├── quartoutils
├── s-partitus-behavior
├── sculptors
├── sculptors-psf
├── trait-psf-metaanalysis
└── urban-phenoWhy think about file structure?
- Every file is stored somewhere on your computer
- If you want to analyze it in
R(or other programs), you will need to read it into memory
How file paths work
- Each file path has the same structure:
parent-directory/sub-directory/sub-sub-directory/file.csv
- We can describe file paths using absolute or relative notation.
Absolute paths
Absolute notation: the “starting point” is the “root” directory in your computer
Exercise:
- Open RStudio and tab over to the “Terminal” pane on the bottom
- If you are working in an RProject, close the project.
- Enter the command
cd - Enter the command
pwd - This is the starting point for all absolute paths you use on your computer.
- Notice: Everyone in this room will have a different path!
- Using absolute paths makes it harder to share code
Relative paths
Relative notation: Provide the path to a file relative to a “standard” starting point.
Exercise
- Create a new Rstudio project, and call it “bioinformatics-workshop”
- Save it on your Desktop for easy access
- As you create it, select the “create with a git repository” checkbox - we will return to this.
- In the terminal enter the command
pwd - Notice that the first few directory names will be different, but after
Desktop/, everyone should be in thebioinformatics-workshopsubdirectory.
Organizing files within projects
What are some problems with this organization?
Some heuristics for good management
Hard and fast rules don’t always work - think about the needs of each project and decide accordingly
All work related to a given project should be housed within one directory (organize with sub-directories)
Many projects will need a few standard subdirectories:
data,code,writing,admin, etc.Raw data should be read-only (never change raw data)
Clean data should be generated through code (don’t hand-change files)
Carefully consider your naming scheme, and make it machine readable.
- Bad example:
FINAL-figure2.png,FINAL-figure2-NEW.png - Better example
figures/figure2-20250324.png,figure/figure2-20250326.png
- Bad example:
Exercise
- Think about the different file types you have generated for your project so far.
- Where are these files stored?
- What would you have to do to “archive” these files for paper submission, or to share with your advisor?
- When you sit down to analyze your data, where/how do you start?
Writing with Quarto/Markdown
Markdown overview
- Markdown is a simple language that allows us to write in “plain” text and generate “rich” documents in Word, PDF, or HTML format.
- e.g. Adding
*one asterisk*around text generates bold text: one asterisk - Adding
**two asterisks**around text generates bold text: two asterisks
- e.g. Adding
Markdown exercise
- In your
bioinformatics-workshopRProject, create a new Markdown file. - Create a document that uses five of the Markdown features documented at this link: https://quarto.org/docs/authoring/markdown-basics.html
Integrating Markdown with code through quarto
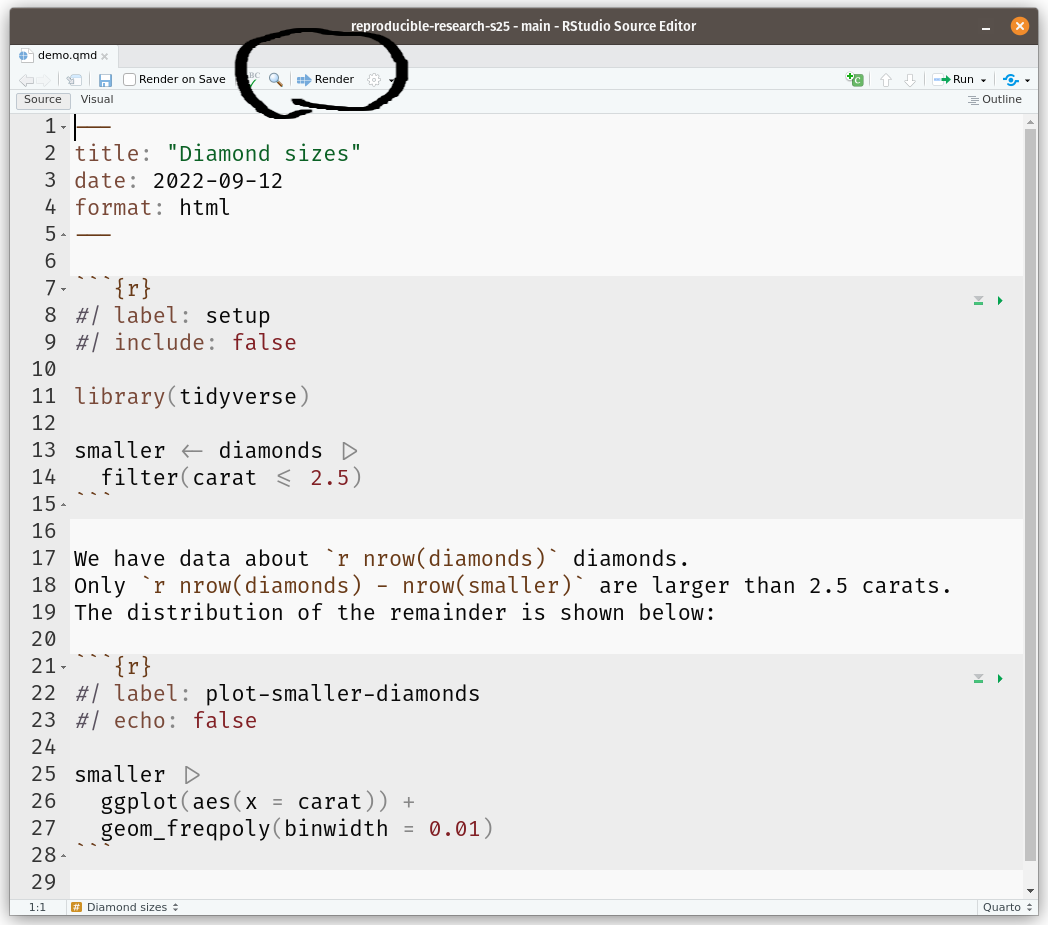
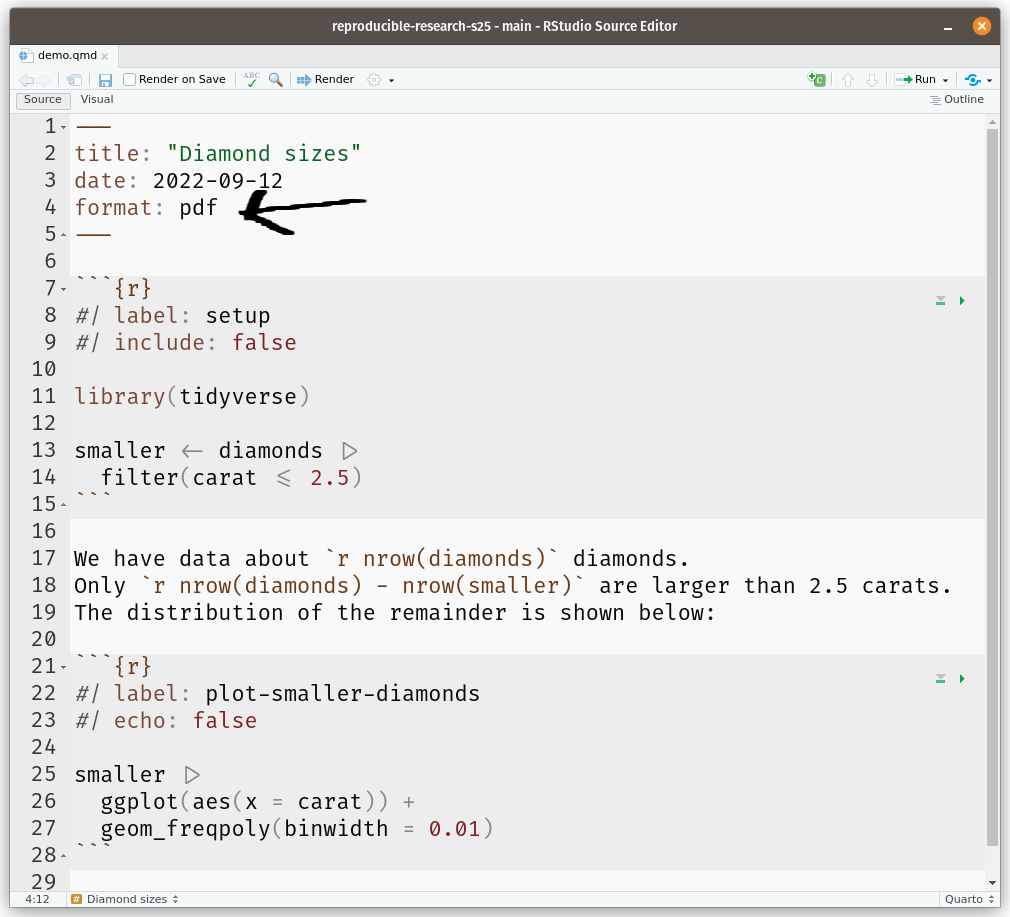
Anatomy of a qmd file
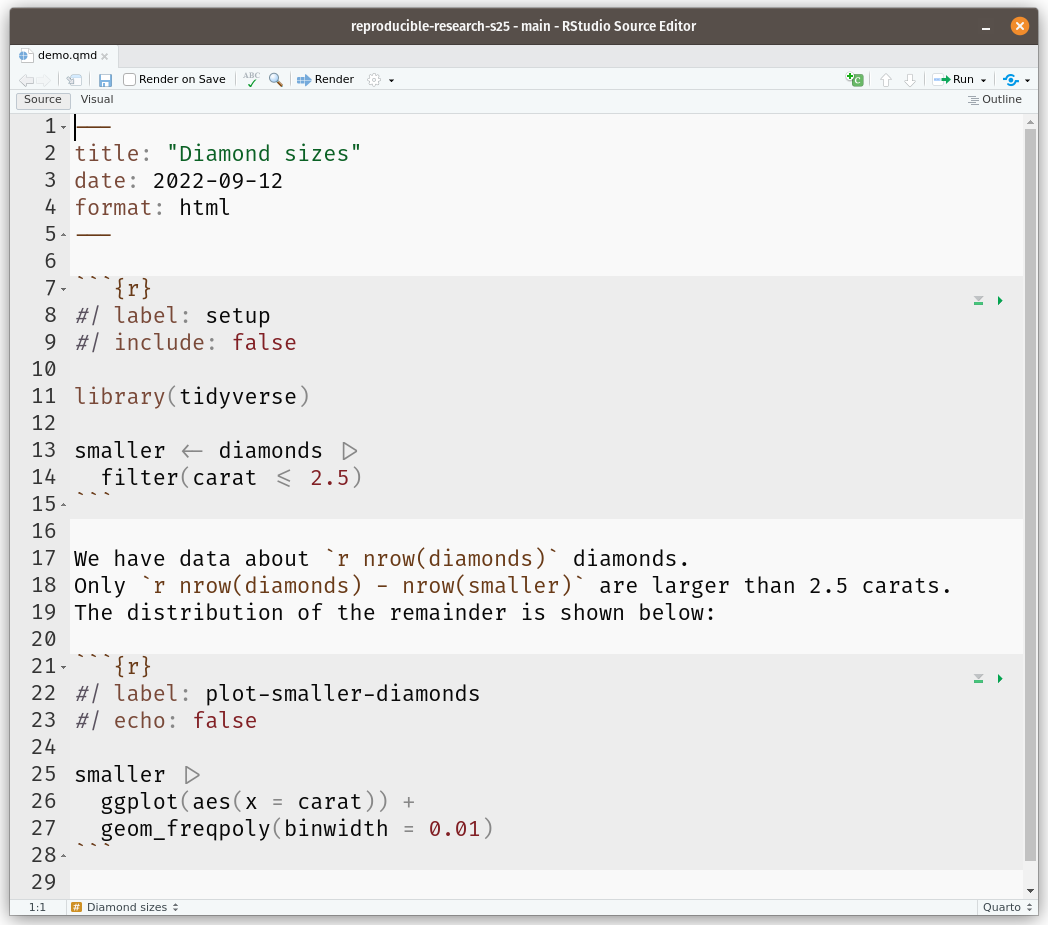
(link to download this file)
Lines 1–5: “YAML” header - this is the space to add information about your file (title, author, date, additional details).
- Demarcated by three dashes (
---) - Always appear in
key: valueformat - Lots of possible options – see this guide for details.
- No need to get overwhelmed by the options for now - but good to keep in mind for future projects.
Lines 7–15: R code chunk
- Demarcated by three ticks, followed by the programming language name (
```{r} {code} ```) - Lines 8–9 are options for the R code chunk - these control, e.g. whether the code is run or not, how big figures are, etc.
- Lines 11–15 are standard R code
Lines 16–20: Text in Markdown
- This is text meant to be read by humans
- Can customize how text is rendered, e.g. adding
*around a word to italicize:*quarto*becomes quarto - Read about additional formatting options here
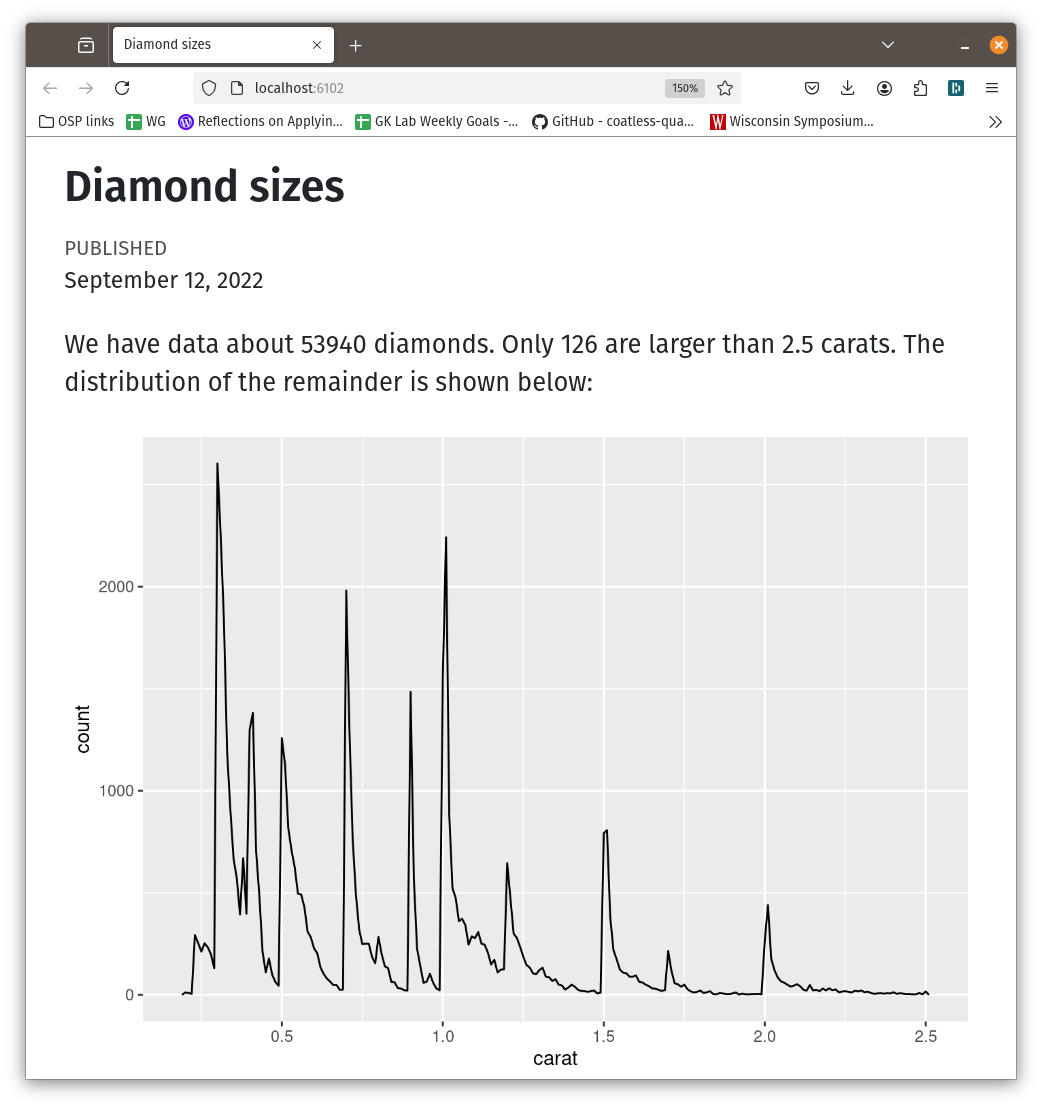
What to do with qmd files
- Render (i.e. “generate”) into a “public facing” document, with all the source code readily available.
- Settings for rendering are based on the
YAMLheader of the file
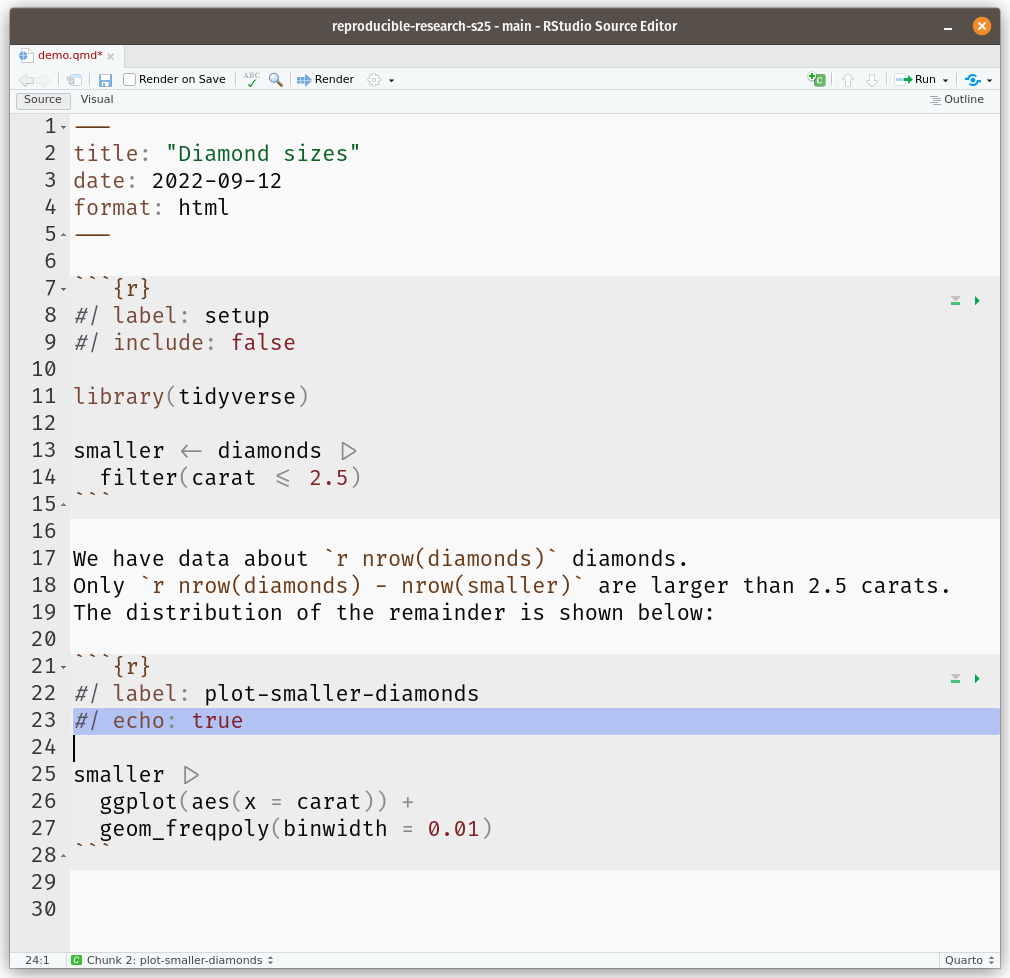
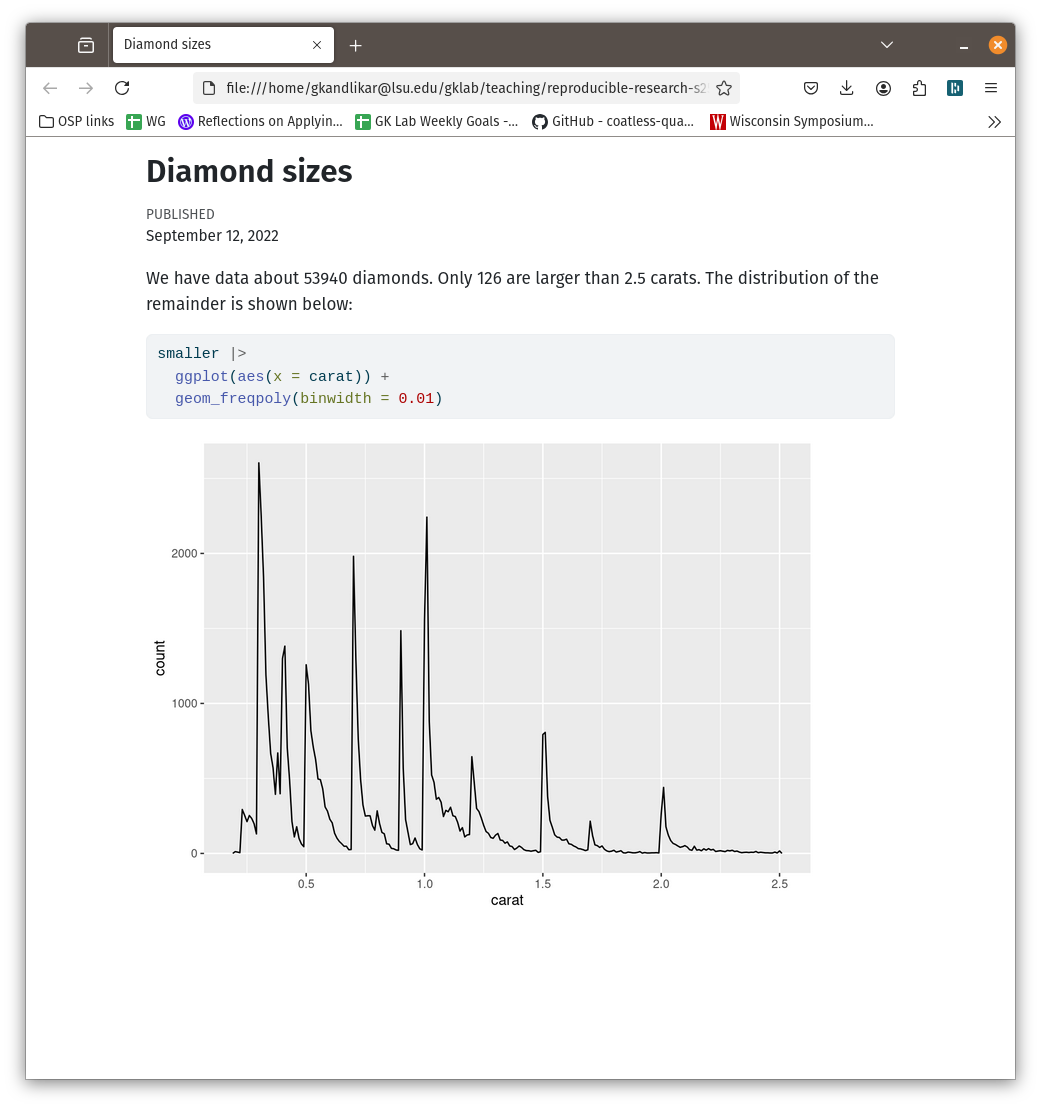
Exercise
- In the same PRoject, create a new Quarto Document
- Render the document to HTML and Docx
- Tweak some of the code and verify that the new results are generated.
Publication-ready graphics with ggplot

We tend to make inferences about relationships between the objects that we see in ways that bear on our interpretation of graphical data, for example. Arrangements of points and lines on a page can encourage us—sometimes quite unconsciously—to make inferences about similarities, clustering, distinctions, and causal relationships that might or might not be there in the numbers. Sometimes these perceptual tendencies can be honestly harnessed to make our graphics more effective. At other times, they will tend to lead us astray, and must take care not to lean on them too much.
— Kieran Healy, Data Visualization: A practical introduction
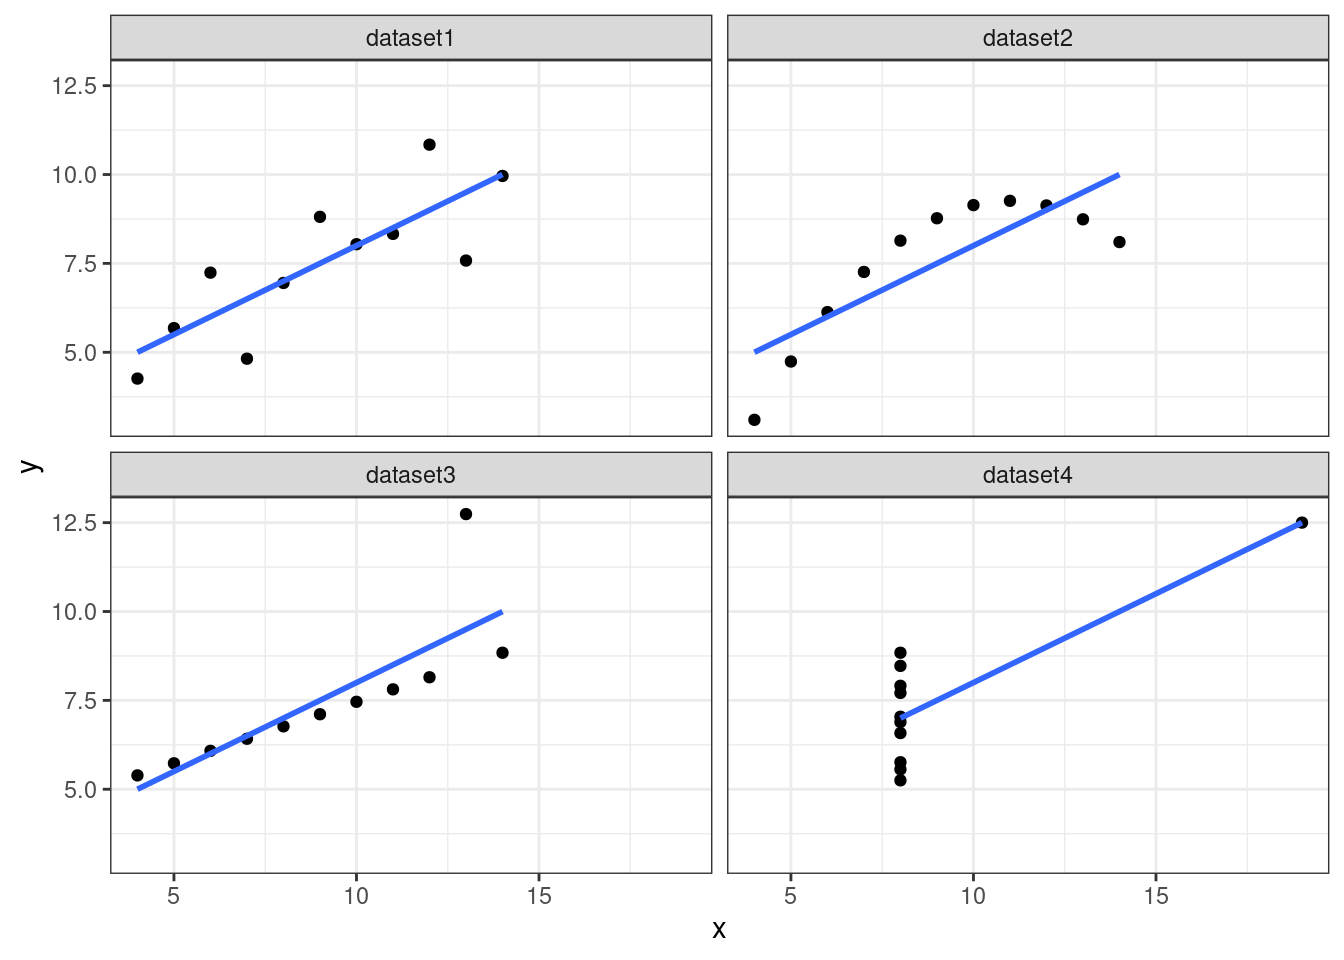
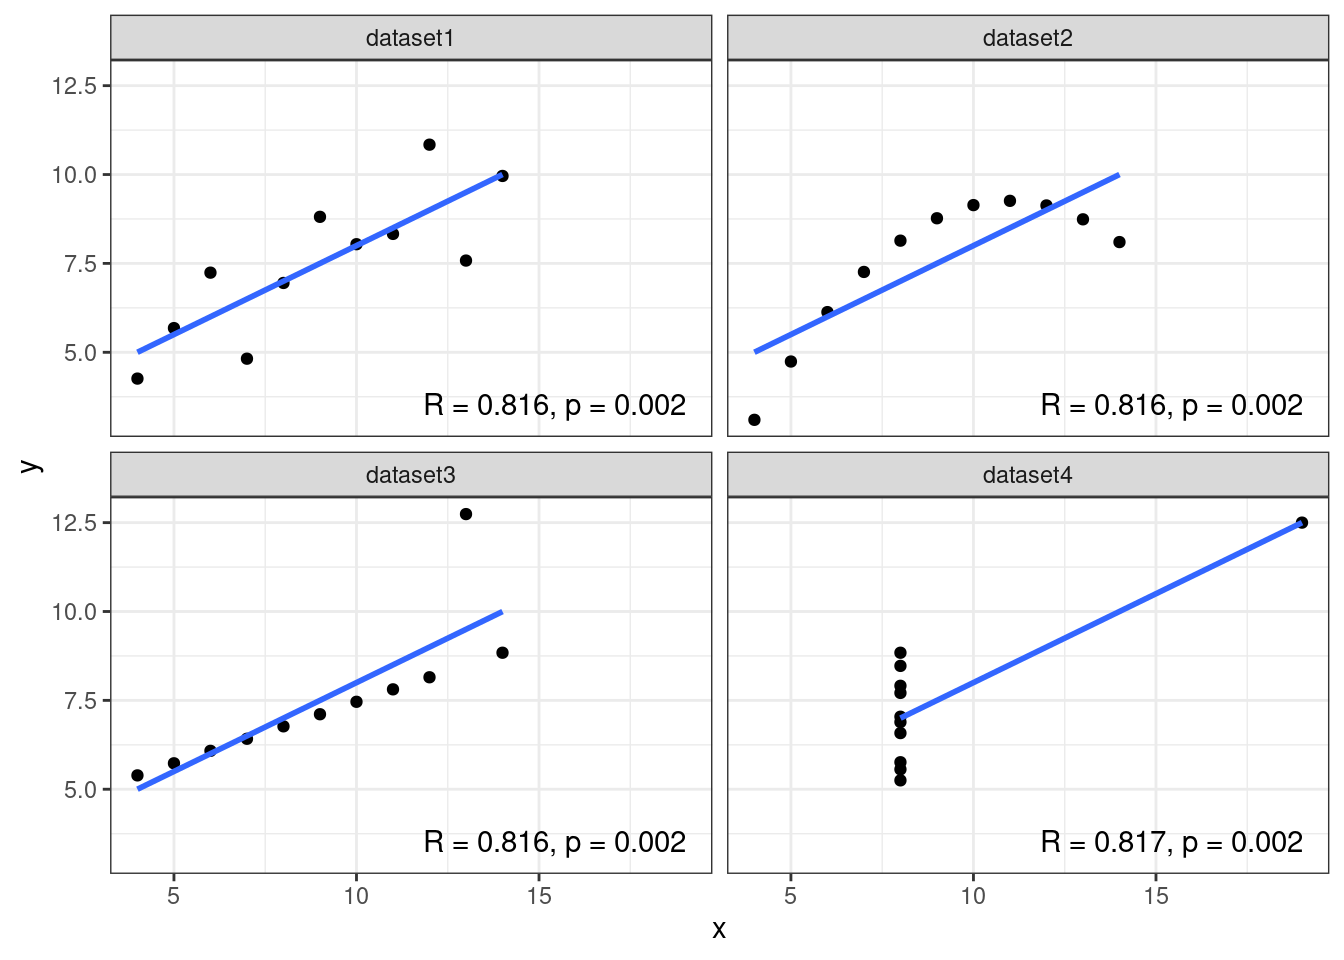
Anscombe’s quartet
Code
library(tidyverse)
library(glue)
library(gt)
# reshape anscombe data in tidy format
ans <-
  anscombe |>
  as_tibble() |>
  pivot_longer(x1:y4) |>
  mutate(dataset = case_when(str_detect(name, "1") ~ "dataset1",
                             str_detect(name, "2") ~ "dataset2",
                             str_detect(name, "3") ~ "dataset3",
                             str_detect(name, "4") ~ "dataset4")) |>
  mutate(xory = ifelse(str_detect(name, "x"), "x", "y")) |>
  select(-name) |>
  pivot_wider(names_from = xory, values_from = value, values_fn = list) |>
  unnest(cols = c("x","y"))

# Define a function to make labels for plots
labler <- function(rsq,pval) glue("R = {rsq}, p = {pval}")

# generate linear models, extract p-vals and rsq; generate labels
ans_sum <-
  ans |>
  group_by(dataset) |>
  nest() |>
  mutate(linmod = map(data, \(data)
                      lm(y~x, data = data)),
         linmod_s = map(linmod, summary),
         rsq = map_dbl(linmod_s, \(sum) round(sqrt(sum$r.squared),3)),
         pval = map_chr(linmod_s, \(sum) scales::pvalue(sum$coefficients[2,4])),
         label = map2_chr(rsq, pval, labler))
ans_plot <-
  ans |>
  ggplot(aes(x = x, y = y))  +
  geom_point() +
  facet_wrap(.~dataset, nrow = 2) +
  theme_bw()

ans_plot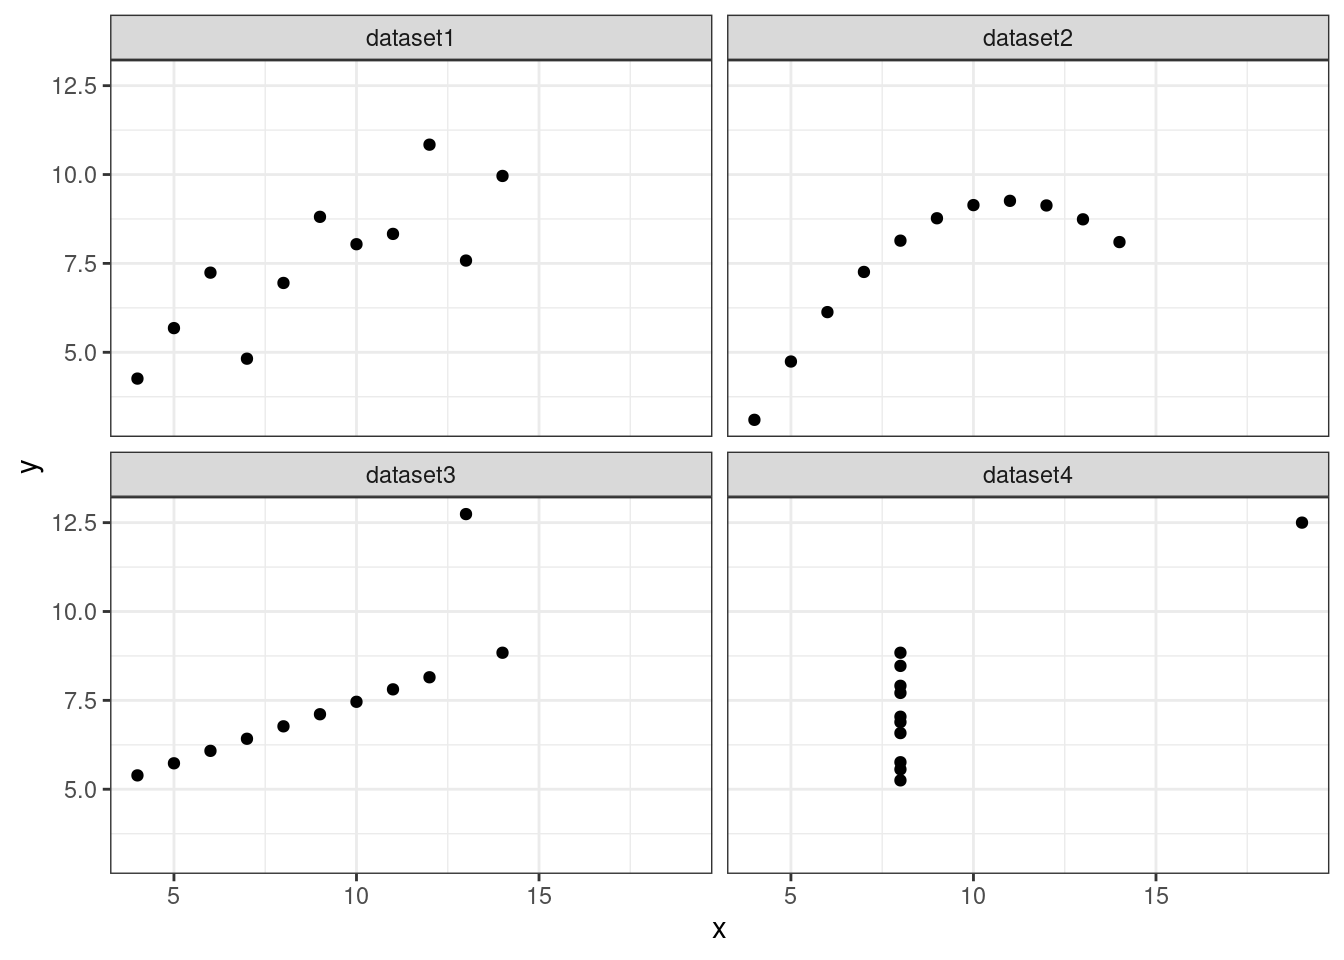
Anscombe’s quartet
Anscombe’s quartet

Illustrations like this demonstrate why it is worth looking at data. But that does not mean that looking at data is all one needs to do. Real datasets are messy, and while displaying them graphically is very useful, doing so presents problems of its own. As we will see below, there is considerable debate about what sort of visual work is most effective, when it can be superfluous, and how it can at times be misleading to researchers and audiences alike.
— Kieran Healy, Data Visualization: A practical introduction
Principles for data visualization
All data visualizations map data values into quantifiable features of the resulting graphic.
— Clause Wilke, Fundamentals of Data Visualization
Mapping features of the data onto aesthetics of a graphic
Code
flowchart LR
  A(Quantitative variable) --> B(Position on figure) --> F(Position on X-axis, Y-axis, ...)
  A --> C(Size of visual element)
  A --> D(Color of visual element)
Code
flowchart LR
  A(Categorical variable) --> B(Shape of visual element) --> C(Shape of point, stroke of line)
  A --> D(Colour of visual element)
Categorical variables can be ordered or unordered. Examples?
Mapping features of the data onto aesthetics of a graphic
How to choose the right map?
- The map should be capable of encoding the data
- e.g. Shapes are a poor choice for encoding quantitative variables
- The map should be effective at encoding the data
- The subject of research on how brains work
Identifying the geometry for the plot
- The geometry determines how the data are shown
- In ggplot, you can choose from a large number of
geom_*functions, depending on whether you wish to show points, lines, boxplots, histograms, etc.
Setting the scale for the aesthetics
Code
flowchart LR
  A(Quantitative variable) --> B(Position on figure)
  A --> C(Size of visual element)
  A --> D(Color of visual element) --> G(Species 1 should be blue, Species 2 should be green)
How to choose the right scale?
- The scale should be capable of encoding the data you are presenting
- e.g. If you have data on a dozen species, color might be a poor choice because human brains are not good at distinguishing between a dozen colors.
- The scale should be efficient at encoding the data you are presenting
- E.g. Diverging data (e.g. “least likely to most likely”) best represented by a divergent palette
- The subject of research on how brains work
Research on how humans digest visual information
Some practical examples
We will work with the gapminder dataset in R
| country | continent | year | lifeExp | pop | gdpPercap |
|---|---|---|---|---|---|
| Afghanistan | Asia | 1952 | 28.80100 | 8425333 | 779.4453 |
| Afghanistan | Asia | 1957 | 30.33200 | 9240934 | 820.8530 |
| Afghanistan | Asia | 1962 | 31.99700 | 10267083 | 853.1007 |
| Afghanistan | Asia | 1967 | 34.02000 | 11537966 | 836.1971 |
| Afghanistan | Asia | 1972 | 36.08800 | 13079460 | 739.9811 |
| Afghanistan | Asia | 1977 | 38.43800 | 14880372 | 786.1134 |
| Afghanistan | Asia | 1982 | 39.85400 | 12881816 | 978.0114 |
| Afghanistan | Asia | 1987 | 40.82200 | 13867957 | 852.3959 |
| Afghanistan | Asia | 1992 | 41.67400 | 16317921 | 649.3414 |
| Afghanistan | Asia | 1997 | 41.76300 | 22227415 | 635.3414 |
| Afghanistan | Asia | 2002 | 42.12900 | 25268405 | 726.7341 |
| Afghanistan | Asia | 2007 | 43.82800 | 31889923 | 974.5803 |
| Albania | Europe | 1952 | 55.23000 | 1282697 | 1601.0561 |
| Albania | Europe | 1957 | 59.28000 | 1476505 | 1942.2842 |
| Albania | Europe | 1962 | 64.82000 | 1728137 | 2312.8890 |
| Albania | Europe | 1967 | 66.22000 | 1984060 | 2760.1969 |
| Albania | Europe | 1972 | 67.69000 | 2263554 | 3313.4222 |
| Albania | Europe | 1977 | 68.93000 | 2509048 | 3533.0039 |
| Albania | Europe | 1982 | 70.42000 | 2780097 | 3630.8807 |
| Albania | Europe | 1987 | 72.00000 | 3075321 | 3738.9327 |
| Albania | Europe | 1992 | 71.58100 | 3326498 | 2497.4379 |
| Albania | Europe | 1997 | 72.95000 | 3428038 | 3193.0546 |
| Albania | Europe | 2002 | 75.65100 | 3508512 | 4604.2117 |
| Albania | Europe | 2007 | 76.42300 | 3600523 | 5937.0295 |
| Algeria | Africa | 1952 | 43.07700 | 9279525 | 2449.0082 |
| Algeria | Africa | 1957 | 45.68500 | 10270856 | 3013.9760 |
| Algeria | Africa | 1962 | 48.30300 | 11000948 | 2550.8169 |
| Algeria | Africa | 1967 | 51.40700 | 12760499 | 3246.9918 |
| Algeria | Africa | 1972 | 54.51800 | 14760787 | 4182.6638 |
| Algeria | Africa | 1977 | 58.01400 | 17152804 | 4910.4168 |
| Algeria | Africa | 1982 | 61.36800 | 20033753 | 5745.1602 |
| Algeria | Africa | 1987 | 65.79900 | 23254956 | 5681.3585 |
| Algeria | Africa | 1992 | 67.74400 | 26298373 | 5023.2166 |
| Algeria | Africa | 1997 | 69.15200 | 29072015 | 4797.2951 |
| Algeria | Africa | 2002 | 70.99400 | 31287142 | 5288.0404 |
| Algeria | Africa | 2007 | 72.30100 | 33333216 | 6223.3675 |
| Angola | Africa | 1952 | 30.01500 | 4232095 | 3520.6103 |
| Angola | Africa | 1957 | 31.99900 | 4561361 | 3827.9405 |
| Angola | Africa | 1962 | 34.00000 | 4826015 | 4269.2767 |
| Angola | Africa | 1967 | 35.98500 | 5247469 | 5522.7764 |
| Angola | Africa | 1972 | 37.92800 | 5894858 | 5473.2880 |
| Angola | Africa | 1977 | 39.48300 | 6162675 | 3008.6474 |
| Angola | Africa | 1982 | 39.94200 | 7016384 | 2756.9537 |
| Angola | Africa | 1987 | 39.90600 | 7874230 | 2430.2083 |
| Angola | Africa | 1992 | 40.64700 | 8735988 | 2627.8457 |
| Angola | Africa | 1997 | 40.96300 | 9875024 | 2277.1409 |
| Angola | Africa | 2002 | 41.00300 | 10866106 | 2773.2873 |
| Angola | Africa | 2007 | 42.73100 | 12420476 | 4797.2313 |
| Argentina | Americas | 1952 | 62.48500 | 17876956 | 5911.3151 |
| Argentina | Americas | 1957 | 64.39900 | 19610538 | 6856.8562 |
| Argentina | Americas | 1962 | 65.14200 | 21283783 | 7133.1660 |
| Argentina | Americas | 1967 | 65.63400 | 22934225 | 8052.9530 |
| Argentina | Americas | 1972 | 67.06500 | 24779799 | 9443.0385 |
| Argentina | Americas | 1977 | 68.48100 | 26983828 | 10079.0267 |
| Argentina | Americas | 1982 | 69.94200 | 29341374 | 8997.8974 |
| Argentina | Americas | 1987 | 70.77400 | 31620918 | 9139.6714 |
| Argentina | Americas | 1992 | 71.86800 | 33958947 | 9308.4187 |
| Argentina | Americas | 1997 | 73.27500 | 36203463 | 10967.2820 |
| Argentina | Americas | 2002 | 74.34000 | 38331121 | 8797.6407 |
| Argentina | Americas | 2007 | 75.32000 | 40301927 | 12779.3796 |
| Australia | Oceania | 1952 | 69.12000 | 8691212 | 10039.5956 |
| Australia | Oceania | 1957 | 70.33000 | 9712569 | 10949.6496 |
| Australia | Oceania | 1962 | 70.93000 | 10794968 | 12217.2269 |
| Australia | Oceania | 1967 | 71.10000 | 11872264 | 14526.1246 |
| Australia | Oceania | 1972 | 71.93000 | 13177000 | 16788.6295 |
| Australia | Oceania | 1977 | 73.49000 | 14074100 | 18334.1975 |
| Australia | Oceania | 1982 | 74.74000 | 15184200 | 19477.0093 |
| Australia | Oceania | 1987 | 76.32000 | 16257249 | 21888.8890 |
| Australia | Oceania | 1992 | 77.56000 | 17481977 | 23424.7668 |
| Australia | Oceania | 1997 | 78.83000 | 18565243 | 26997.9366 |
| Australia | Oceania | 2002 | 80.37000 | 19546792 | 30687.7547 |
| Australia | Oceania | 2007 | 81.23500 | 20434176 | 34435.3674 |
| Austria | Europe | 1952 | 66.80000 | 6927772 | 6137.0765 |
| Austria | Europe | 1957 | 67.48000 | 6965860 | 8842.5980 |
| Austria | Europe | 1962 | 69.54000 | 7129864 | 10750.7211 |
| Austria | Europe | 1967 | 70.14000 | 7376998 | 12834.6024 |
| Austria | Europe | 1972 | 70.63000 | 7544201 | 16661.6256 |
| Austria | Europe | 1977 | 72.17000 | 7568430 | 19749.4223 |
| Austria | Europe | 1982 | 73.18000 | 7574613 | 21597.0836 |
| Austria | Europe | 1987 | 74.94000 | 7578903 | 23687.8261 |
| Austria | Europe | 1992 | 76.04000 | 7914969 | 27042.0187 |
| Austria | Europe | 1997 | 77.51000 | 8069876 | 29095.9207 |
| Austria | Europe | 2002 | 78.98000 | 8148312 | 32417.6077 |
| Austria | Europe | 2007 | 79.82900 | 8199783 | 36126.4927 |
| Bahrain | Asia | 1952 | 50.93900 | 120447 | 9867.0848 |
| Bahrain | Asia | 1957 | 53.83200 | 138655 | 11635.7995 |
| Bahrain | Asia | 1962 | 56.92300 | 171863 | 12753.2751 |
| Bahrain | Asia | 1967 | 59.92300 | 202182 | 14804.6727 |
| Bahrain | Asia | 1972 | 63.30000 | 230800 | 18268.6584 |
| Bahrain | Asia | 1977 | 65.59300 | 297410 | 19340.1020 |
| Bahrain | Asia | 1982 | 69.05200 | 377967 | 19211.1473 |
| Bahrain | Asia | 1987 | 70.75000 | 454612 | 18524.0241 |
| Bahrain | Asia | 1992 | 72.60100 | 529491 | 19035.5792 |
| Bahrain | Asia | 1997 | 73.92500 | 598561 | 20292.0168 |
| Bahrain | Asia | 2002 | 74.79500 | 656397 | 23403.5593 |
| Bahrain | Asia | 2007 | 75.63500 | 708573 | 29796.0483 |
| Bangladesh | Asia | 1952 | 37.48400 | 46886859 | 684.2442 |
| Bangladesh | Asia | 1957 | 39.34800 | 51365468 | 661.6375 |
| Bangladesh | Asia | 1962 | 41.21600 | 56839289 | 686.3416 |
| Bangladesh | Asia | 1967 | 43.45300 | 62821884 | 721.1861 |
| Bangladesh | Asia | 1972 | 45.25200 | 70759295 | 630.2336 |
| Bangladesh | Asia | 1977 | 46.92300 | 80428306 | 659.8772 |
| Bangladesh | Asia | 1982 | 50.00900 | 93074406 | 676.9819 |
| Bangladesh | Asia | 1987 | 52.81900 | 103764241 | 751.9794 |
| Bangladesh | Asia | 1992 | 56.01800 | 113704579 | 837.8102 |
| Bangladesh | Asia | 1997 | 59.41200 | 123315288 | 972.7700 |
| Bangladesh | Asia | 2002 | 62.01300 | 135656790 | 1136.3904 |
| Bangladesh | Asia | 2007 | 64.06200 | 150448339 | 1391.2538 |
| Belgium | Europe | 1952 | 68.00000 | 8730405 | 8343.1051 |
| Belgium | Europe | 1957 | 69.24000 | 8989111 | 9714.9606 |
| Belgium | Europe | 1962 | 70.25000 | 9218400 | 10991.2068 |
| Belgium | Europe | 1967 | 70.94000 | 9556500 | 13149.0412 |
| Belgium | Europe | 1972 | 71.44000 | 9709100 | 16672.1436 |
| Belgium | Europe | 1977 | 72.80000 | 9821800 | 19117.9745 |
| Belgium | Europe | 1982 | 73.93000 | 9856303 | 20979.8459 |
| Belgium | Europe | 1987 | 75.35000 | 9870200 | 22525.5631 |
| Belgium | Europe | 1992 | 76.46000 | 10045622 | 25575.5707 |
| Belgium | Europe | 1997 | 77.53000 | 10199787 | 27561.1966 |
| Belgium | Europe | 2002 | 78.32000 | 10311970 | 30485.8838 |
| Belgium | Europe | 2007 | 79.44100 | 10392226 | 33692.6051 |
| Benin | Africa | 1952 | 38.22300 | 1738315 | 1062.7522 |
| Benin | Africa | 1957 | 40.35800 | 1925173 | 959.6011 |
| Benin | Africa | 1962 | 42.61800 | 2151895 | 949.4991 |
| Benin | Africa | 1967 | 44.88500 | 2427334 | 1035.8314 |
| Benin | Africa | 1972 | 47.01400 | 2761407 | 1085.7969 |
| Benin | Africa | 1977 | 49.19000 | 3168267 | 1029.1613 |
| Benin | Africa | 1982 | 50.90400 | 3641603 | 1277.8976 |
| Benin | Africa | 1987 | 52.33700 | 4243788 | 1225.8560 |
| Benin | Africa | 1992 | 53.91900 | 4981671 | 1191.2077 |
| Benin | Africa | 1997 | 54.77700 | 6066080 | 1232.9753 |
| Benin | Africa | 2002 | 54.40600 | 7026113 | 1372.8779 |
| Benin | Africa | 2007 | 56.72800 | 8078314 | 1441.2849 |
| Bolivia | Americas | 1952 | 40.41400 | 2883315 | 2677.3263 |
| Bolivia | Americas | 1957 | 41.89000 | 3211738 | 2127.6863 |
| Bolivia | Americas | 1962 | 43.42800 | 3593918 | 2180.9725 |
| Bolivia | Americas | 1967 | 45.03200 | 4040665 | 2586.8861 |
| Bolivia | Americas | 1972 | 46.71400 | 4565872 | 2980.3313 |
| Bolivia | Americas | 1977 | 50.02300 | 5079716 | 3548.0978 |
| Bolivia | Americas | 1982 | 53.85900 | 5642224 | 3156.5105 |
| Bolivia | Americas | 1987 | 57.25100 | 6156369 | 2753.6915 |
| Bolivia | Americas | 1992 | 59.95700 | 6893451 | 2961.6997 |
| Bolivia | Americas | 1997 | 62.05000 | 7693188 | 3326.1432 |
| Bolivia | Americas | 2002 | 63.88300 | 8445134 | 3413.2627 |
| Bolivia | Americas | 2007 | 65.55400 | 9119152 | 3822.1371 |
| Bosnia and Herzegovina | Europe | 1952 | 53.82000 | 2791000 | 973.5332 |
| Bosnia and Herzegovina | Europe | 1957 | 58.45000 | 3076000 | 1353.9892 |
| Bosnia and Herzegovina | Europe | 1962 | 61.93000 | 3349000 | 1709.6837 |
| Bosnia and Herzegovina | Europe | 1967 | 64.79000 | 3585000 | 2172.3524 |
| Bosnia and Herzegovina | Europe | 1972 | 67.45000 | 3819000 | 2860.1698 |
| Bosnia and Herzegovina | Europe | 1977 | 69.86000 | 4086000 | 3528.4813 |
| Bosnia and Herzegovina | Europe | 1982 | 70.69000 | 4172693 | 4126.6132 |
| Bosnia and Herzegovina | Europe | 1987 | 71.14000 | 4338977 | 4314.1148 |
| Bosnia and Herzegovina | Europe | 1992 | 72.17800 | 4256013 | 2546.7814 |
| Bosnia and Herzegovina | Europe | 1997 | 73.24400 | 3607000 | 4766.3559 |
| Bosnia and Herzegovina | Europe | 2002 | 74.09000 | 4165416 | 6018.9752 |
| Bosnia and Herzegovina | Europe | 2007 | 74.85200 | 4552198 | 7446.2988 |
| Botswana | Africa | 1952 | 47.62200 | 442308 | 851.2411 |
| Botswana | Africa | 1957 | 49.61800 | 474639 | 918.2325 |
| Botswana | Africa | 1962 | 51.52000 | 512764 | 983.6540 |
| Botswana | Africa | 1967 | 53.29800 | 553541 | 1214.7093 |
| Botswana | Africa | 1972 | 56.02400 | 619351 | 2263.6111 |
| Botswana | Africa | 1977 | 59.31900 | 781472 | 3214.8578 |
| Botswana | Africa | 1982 | 61.48400 | 970347 | 4551.1421 |
| Botswana | Africa | 1987 | 63.62200 | 1151184 | 6205.8839 |
| Botswana | Africa | 1992 | 62.74500 | 1342614 | 7954.1116 |
| Botswana | Africa | 1997 | 52.55600 | 1536536 | 8647.1423 |
| Botswana | Africa | 2002 | 46.63400 | 1630347 | 11003.6051 |
| Botswana | Africa | 2007 | 50.72800 | 1639131 | 12569.8518 |
| Brazil | Americas | 1952 | 50.91700 | 56602560 | 2108.9444 |
| Brazil | Americas | 1957 | 53.28500 | 65551171 | 2487.3660 |
| Brazil | Americas | 1962 | 55.66500 | 76039390 | 3336.5858 |
| Brazil | Americas | 1967 | 57.63200 | 88049823 | 3429.8644 |
| Brazil | Americas | 1972 | 59.50400 | 100840058 | 4985.7115 |
| Brazil | Americas | 1977 | 61.48900 | 114313951 | 6660.1187 |
| Brazil | Americas | 1982 | 63.33600 | 128962939 | 7030.8359 |
| Brazil | Americas | 1987 | 65.20500 | 142938076 | 7807.0958 |
| Brazil | Americas | 1992 | 67.05700 | 155975974 | 6950.2830 |
| Brazil | Americas | 1997 | 69.38800 | 168546719 | 7957.9808 |
| Brazil | Americas | 2002 | 71.00600 | 179914212 | 8131.2128 |
| Brazil | Americas | 2007 | 72.39000 | 190010647 | 9065.8008 |
| Bulgaria | Europe | 1952 | 59.60000 | 7274900 | 2444.2866 |
| Bulgaria | Europe | 1957 | 66.61000 | 7651254 | 3008.6707 |
| Bulgaria | Europe | 1962 | 69.51000 | 8012946 | 4254.3378 |
| Bulgaria | Europe | 1967 | 70.42000 | 8310226 | 5577.0028 |
| Bulgaria | Europe | 1972 | 70.90000 | 8576200 | 6597.4944 |
| Bulgaria | Europe | 1977 | 70.81000 | 8797022 | 7612.2404 |
| Bulgaria | Europe | 1982 | 71.08000 | 8892098 | 8224.1916 |
| Bulgaria | Europe | 1987 | 71.34000 | 8971958 | 8239.8548 |
| Bulgaria | Europe | 1992 | 71.19000 | 8658506 | 6302.6234 |
| Bulgaria | Europe | 1997 | 70.32000 | 8066057 | 5970.3888 |
| Bulgaria | Europe | 2002 | 72.14000 | 7661799 | 7696.7777 |
| Bulgaria | Europe | 2007 | 73.00500 | 7322858 | 10680.7928 |
| Burkina Faso | Africa | 1952 | 31.97500 | 4469979 | 543.2552 |
| Burkina Faso | Africa | 1957 | 34.90600 | 4713416 | 617.1835 |
| Burkina Faso | Africa | 1962 | 37.81400 | 4919632 | 722.5120 |
| Burkina Faso | Africa | 1967 | 40.69700 | 5127935 | 794.8266 |
| Burkina Faso | Africa | 1972 | 43.59100 | 5433886 | 854.7360 |
| Burkina Faso | Africa | 1977 | 46.13700 | 5889574 | 743.3870 |
| Burkina Faso | Africa | 1982 | 48.12200 | 6634596 | 807.1986 |
| Burkina Faso | Africa | 1987 | 49.55700 | 7586551 | 912.0631 |
| Burkina Faso | Africa | 1992 | 50.26000 | 8878303 | 931.7528 |
| Burkina Faso | Africa | 1997 | 50.32400 | 10352843 | 946.2950 |
| Burkina Faso | Africa | 2002 | 50.65000 | 12251209 | 1037.6452 |
| Burkina Faso | Africa | 2007 | 52.29500 | 14326203 | 1217.0330 |
| Burundi | Africa | 1952 | 39.03100 | 2445618 | 339.2965 |
| Burundi | Africa | 1957 | 40.53300 | 2667518 | 379.5646 |
| Burundi | Africa | 1962 | 42.04500 | 2961915 | 355.2032 |
| Burundi | Africa | 1967 | 43.54800 | 3330989 | 412.9775 |
| Burundi | Africa | 1972 | 44.05700 | 3529983 | 464.0995 |
| Burundi | Africa | 1977 | 45.91000 | 3834415 | 556.1033 |
| Burundi | Africa | 1982 | 47.47100 | 4580410 | 559.6032 |
| Burundi | Africa | 1987 | 48.21100 | 5126023 | 621.8188 |
| Burundi | Africa | 1992 | 44.73600 | 5809236 | 631.6999 |
| Burundi | Africa | 1997 | 45.32600 | 6121610 | 463.1151 |
| Burundi | Africa | 2002 | 47.36000 | 7021078 | 446.4035 |
| Burundi | Africa | 2007 | 49.58000 | 8390505 | 430.0707 |
| Cambodia | Asia | 1952 | 39.41700 | 4693836 | 368.4693 |
| Cambodia | Asia | 1957 | 41.36600 | 5322536 | 434.0383 |
| Cambodia | Asia | 1962 | 43.41500 | 6083619 | 496.9136 |
| Cambodia | Asia | 1967 | 45.41500 | 6960067 | 523.4323 |
| Cambodia | Asia | 1972 | 40.31700 | 7450606 | 421.6240 |
| Cambodia | Asia | 1977 | 31.22000 | 6978607 | 524.9722 |
| Cambodia | Asia | 1982 | 50.95700 | 7272485 | 624.4755 |
| Cambodia | Asia | 1987 | 53.91400 | 8371791 | 683.8956 |
| Cambodia | Asia | 1992 | 55.80300 | 10150094 | 682.3032 |
| Cambodia | Asia | 1997 | 56.53400 | 11782962 | 734.2852 |
| Cambodia | Asia | 2002 | 56.75200 | 12926707 | 896.2260 |
| Cambodia | Asia | 2007 | 59.72300 | 14131858 | 1713.7787 |
| Cameroon | Africa | 1952 | 38.52300 | 5009067 | 1172.6677 |
| Cameroon | Africa | 1957 | 40.42800 | 5359923 | 1313.0481 |
| Cameroon | Africa | 1962 | 42.64300 | 5793633 | 1399.6074 |
| Cameroon | Africa | 1967 | 44.79900 | 6335506 | 1508.4531 |
| Cameroon | Africa | 1972 | 47.04900 | 7021028 | 1684.1465 |
| Cameroon | Africa | 1977 | 49.35500 | 7959865 | 1783.4329 |
| Cameroon | Africa | 1982 | 52.96100 | 9250831 | 2367.9833 |
| Cameroon | Africa | 1987 | 54.98500 | 10780667 | 2602.6642 |
| Cameroon | Africa | 1992 | 54.31400 | 12467171 | 1793.1633 |
| Cameroon | Africa | 1997 | 52.19900 | 14195809 | 1694.3375 |
| Cameroon | Africa | 2002 | 49.85600 | 15929988 | 1934.0114 |
| Cameroon | Africa | 2007 | 50.43000 | 17696293 | 2042.0952 |
| Canada | Americas | 1952 | 68.75000 | 14785584 | 11367.1611 |
| Canada | Americas | 1957 | 69.96000 | 17010154 | 12489.9501 |
| Canada | Americas | 1962 | 71.30000 | 18985849 | 13462.4855 |
| Canada | Americas | 1967 | 72.13000 | 20819767 | 16076.5880 |
| Canada | Americas | 1972 | 72.88000 | 22284500 | 18970.5709 |
| Canada | Americas | 1977 | 74.21000 | 23796400 | 22090.8831 |
| Canada | Americas | 1982 | 75.76000 | 25201900 | 22898.7921 |
| Canada | Americas | 1987 | 76.86000 | 26549700 | 26626.5150 |
| Canada | Americas | 1992 | 77.95000 | 28523502 | 26342.8843 |
| Canada | Americas | 1997 | 78.61000 | 30305843 | 28954.9259 |
| Canada | Americas | 2002 | 79.77000 | 31902268 | 33328.9651 |
| Canada | Americas | 2007 | 80.65300 | 33390141 | 36319.2350 |
| Central African Republic | Africa | 1952 | 35.46300 | 1291695 | 1071.3107 |
| Central African Republic | Africa | 1957 | 37.46400 | 1392284 | 1190.8443 |
| Central African Republic | Africa | 1962 | 39.47500 | 1523478 | 1193.0688 |
| Central African Republic | Africa | 1967 | 41.47800 | 1733638 | 1136.0566 |
| Central African Republic | Africa | 1972 | 43.45700 | 1927260 | 1070.0133 |
| Central African Republic | Africa | 1977 | 46.77500 | 2167533 | 1109.3743 |
| Central African Republic | Africa | 1982 | 48.29500 | 2476971 | 956.7530 |
| Central African Republic | Africa | 1987 | 50.48500 | 2840009 | 844.8764 |
| Central African Republic | Africa | 1992 | 49.39600 | 3265124 | 747.9055 |
| Central African Republic | Africa | 1997 | 46.06600 | 3696513 | 740.5063 |
| Central African Republic | Africa | 2002 | 43.30800 | 4048013 | 738.6906 |
| Central African Republic | Africa | 2007 | 44.74100 | 4369038 | 706.0165 |
| Chad | Africa | 1952 | 38.09200 | 2682462 | 1178.6659 |
| Chad | Africa | 1957 | 39.88100 | 2894855 | 1308.4956 |
| Chad | Africa | 1962 | 41.71600 | 3150417 | 1389.8176 |
| Chad | Africa | 1967 | 43.60100 | 3495967 | 1196.8106 |
| Chad | Africa | 1972 | 45.56900 | 3899068 | 1104.1040 |
| Chad | Africa | 1977 | 47.38300 | 4388260 | 1133.9850 |
| Chad | Africa | 1982 | 49.51700 | 4875118 | 797.9081 |
| Chad | Africa | 1987 | 51.05100 | 5498955 | 952.3861 |
| Chad | Africa | 1992 | 51.72400 | 6429417 | 1058.0643 |
| Chad | Africa | 1997 | 51.57300 | 7562011 | 1004.9614 |
| Chad | Africa | 2002 | 50.52500 | 8835739 | 1156.1819 |
| Chad | Africa | 2007 | 50.65100 | 10238807 | 1704.0637 |
| Chile | Americas | 1952 | 54.74500 | 6377619 | 3939.9788 |
| Chile | Americas | 1957 | 56.07400 | 7048426 | 4315.6227 |
| Chile | Americas | 1962 | 57.92400 | 7961258 | 4519.0943 |
| Chile | Americas | 1967 | 60.52300 | 8858908 | 5106.6543 |
| Chile | Americas | 1972 | 63.44100 | 9717524 | 5494.0244 |
| Chile | Americas | 1977 | 67.05200 | 10599793 | 4756.7638 |
| Chile | Americas | 1982 | 70.56500 | 11487112 | 5095.6657 |
| Chile | Americas | 1987 | 72.49200 | 12463354 | 5547.0638 |
| Chile | Americas | 1992 | 74.12600 | 13572994 | 7596.1260 |
| Chile | Americas | 1997 | 75.81600 | 14599929 | 10118.0532 |
| Chile | Americas | 2002 | 77.86000 | 15497046 | 10778.7838 |
| Chile | Americas | 2007 | 78.55300 | 16284741 | 13171.6388 |
| China | Asia | 1952 | 44.00000 | 556263527 | 400.4486 |
| China | Asia | 1957 | 50.54896 | 637408000 | 575.9870 |
| China | Asia | 1962 | 44.50136 | 665770000 | 487.6740 |
| China | Asia | 1967 | 58.38112 | 754550000 | 612.7057 |
| China | Asia | 1972 | 63.11888 | 862030000 | 676.9001 |
| China | Asia | 1977 | 63.96736 | 943455000 | 741.2375 |
| China | Asia | 1982 | 65.52500 | 1000281000 | 962.4214 |
| China | Asia | 1987 | 67.27400 | 1084035000 | 1378.9040 |
| China | Asia | 1992 | 68.69000 | 1164970000 | 1655.7842 |
| China | Asia | 1997 | 70.42600 | 1230075000 | 2289.2341 |
| China | Asia | 2002 | 72.02800 | 1280400000 | 3119.2809 |
| China | Asia | 2007 | 72.96100 | 1318683096 | 4959.1149 |
| Colombia | Americas | 1952 | 50.64300 | 12350771 | 2144.1151 |
| Colombia | Americas | 1957 | 55.11800 | 14485993 | 2323.8056 |
| Colombia | Americas | 1962 | 57.86300 | 17009885 | 2492.3511 |
| Colombia | Americas | 1967 | 59.96300 | 19764027 | 2678.7298 |
| Colombia | Americas | 1972 | 61.62300 | 22542890 | 3264.6600 |
| Colombia | Americas | 1977 | 63.83700 | 25094412 | 3815.8079 |
| Colombia | Americas | 1982 | 66.65300 | 27764644 | 4397.5757 |
| Colombia | Americas | 1987 | 67.76800 | 30964245 | 4903.2191 |
| Colombia | Americas | 1992 | 68.42100 | 34202721 | 5444.6486 |
| Colombia | Americas | 1997 | 70.31300 | 37657830 | 6117.3617 |
| Colombia | Americas | 2002 | 71.68200 | 41008227 | 5755.2600 |
| Colombia | Americas | 2007 | 72.88900 | 44227550 | 7006.5804 |
| Comoros | Africa | 1952 | 40.71500 | 153936 | 1102.9909 |
| Comoros | Africa | 1957 | 42.46000 | 170928 | 1211.1485 |
| Comoros | Africa | 1962 | 44.46700 | 191689 | 1406.6483 |
| Comoros | Africa | 1967 | 46.47200 | 217378 | 1876.0296 |
| Comoros | Africa | 1972 | 48.94400 | 250027 | 1937.5777 |
| Comoros | Africa | 1977 | 50.93900 | 304739 | 1172.6030 |
| Comoros | Africa | 1982 | 52.93300 | 348643 | 1267.1001 |
| Comoros | Africa | 1987 | 54.92600 | 395114 | 1315.9808 |
| Comoros | Africa | 1992 | 57.93900 | 454429 | 1246.9074 |
| Comoros | Africa | 1997 | 60.66000 | 527982 | 1173.6182 |
| Comoros | Africa | 2002 | 62.97400 | 614382 | 1075.8116 |
| Comoros | Africa | 2007 | 65.15200 | 710960 | 986.1479 |
| Congo, Dem. Rep. | Africa | 1952 | 39.14300 | 14100005 | 780.5423 |
| Congo, Dem. Rep. | Africa | 1957 | 40.65200 | 15577932 | 905.8602 |
| Congo, Dem. Rep. | Africa | 1962 | 42.12200 | 17486434 | 896.3146 |
| Congo, Dem. Rep. | Africa | 1967 | 44.05600 | 19941073 | 861.5932 |
| Congo, Dem. Rep. | Africa | 1972 | 45.98900 | 23007669 | 904.8961 |
| Congo, Dem. Rep. | Africa | 1977 | 47.80400 | 26480870 | 795.7573 |
| Congo, Dem. Rep. | Africa | 1982 | 47.78400 | 30646495 | 673.7478 |
| Congo, Dem. Rep. | Africa | 1987 | 47.41200 | 35481645 | 672.7748 |
| Congo, Dem. Rep. | Africa | 1992 | 45.54800 | 41672143 | 457.7192 |
| Congo, Dem. Rep. | Africa | 1997 | 42.58700 | 47798986 | 312.1884 |
| Congo, Dem. Rep. | Africa | 2002 | 44.96600 | 55379852 | 241.1659 |
| Congo, Dem. Rep. | Africa | 2007 | 46.46200 | 64606759 | 277.5519 |
| Congo, Rep. | Africa | 1952 | 42.11100 | 854885 | 2125.6214 |
| Congo, Rep. | Africa | 1957 | 45.05300 | 940458 | 2315.0566 |
| Congo, Rep. | Africa | 1962 | 48.43500 | 1047924 | 2464.7832 |
| Congo, Rep. | Africa | 1967 | 52.04000 | 1179760 | 2677.9396 |
| Congo, Rep. | Africa | 1972 | 54.90700 | 1340458 | 3213.1527 |
| Congo, Rep. | Africa | 1977 | 55.62500 | 1536769 | 3259.1790 |
| Congo, Rep. | Africa | 1982 | 56.69500 | 1774735 | 4879.5075 |
| Congo, Rep. | Africa | 1987 | 57.47000 | 2064095 | 4201.1949 |
| Congo, Rep. | Africa | 1992 | 56.43300 | 2409073 | 4016.2395 |
| Congo, Rep. | Africa | 1997 | 52.96200 | 2800947 | 3484.1644 |
| Congo, Rep. | Africa | 2002 | 52.97000 | 3328795 | 3484.0620 |
| Congo, Rep. | Africa | 2007 | 55.32200 | 3800610 | 3632.5578 |
| Costa Rica | Americas | 1952 | 57.20600 | 926317 | 2627.0095 |
| Costa Rica | Americas | 1957 | 60.02600 | 1112300 | 2990.0108 |
| Costa Rica | Americas | 1962 | 62.84200 | 1345187 | 3460.9370 |
| Costa Rica | Americas | 1967 | 65.42400 | 1588717 | 4161.7278 |
| Costa Rica | Americas | 1972 | 67.84900 | 1834796 | 5118.1469 |
| Costa Rica | Americas | 1977 | 70.75000 | 2108457 | 5926.8770 |
| Costa Rica | Americas | 1982 | 73.45000 | 2424367 | 5262.7348 |
| Costa Rica | Americas | 1987 | 74.75200 | 2799811 | 5629.9153 |
| Costa Rica | Americas | 1992 | 75.71300 | 3173216 | 6160.4163 |
| Costa Rica | Americas | 1997 | 77.26000 | 3518107 | 6677.0453 |
| Costa Rica | Americas | 2002 | 78.12300 | 3834934 | 7723.4472 |
| Costa Rica | Americas | 2007 | 78.78200 | 4133884 | 9645.0614 |
| Cote d'Ivoire | Africa | 1952 | 40.47700 | 2977019 | 1388.5947 |
| Cote d'Ivoire | Africa | 1957 | 42.46900 | 3300000 | 1500.8959 |
| Cote d'Ivoire | Africa | 1962 | 44.93000 | 3832408 | 1728.8694 |
| Cote d'Ivoire | Africa | 1967 | 47.35000 | 4744870 | 2052.0505 |
| Cote d'Ivoire | Africa | 1972 | 49.80100 | 6071696 | 2378.2011 |
| Cote d'Ivoire | Africa | 1977 | 52.37400 | 7459574 | 2517.7365 |
| Cote d'Ivoire | Africa | 1982 | 53.98300 | 9025951 | 2602.7102 |
| Cote d'Ivoire | Africa | 1987 | 54.65500 | 10761098 | 2156.9561 |
| Cote d'Ivoire | Africa | 1992 | 52.04400 | 12772596 | 1648.0738 |
| Cote d'Ivoire | Africa | 1997 | 47.99100 | 14625967 | 1786.2654 |
| Cote d'Ivoire | Africa | 2002 | 46.83200 | 16252726 | 1648.8008 |
| Cote d'Ivoire | Africa | 2007 | 48.32800 | 18013409 | 1544.7501 |
| Croatia | Europe | 1952 | 61.21000 | 3882229 | 3119.2365 |
| Croatia | Europe | 1957 | 64.77000 | 3991242 | 4338.2316 |
| Croatia | Europe | 1962 | 67.13000 | 4076557 | 5477.8900 |
| Croatia | Europe | 1967 | 68.50000 | 4174366 | 6960.2979 |
| Croatia | Europe | 1972 | 69.61000 | 4225310 | 9164.0901 |
| Croatia | Europe | 1977 | 70.64000 | 4318673 | 11305.3852 |
| Croatia | Europe | 1982 | 70.46000 | 4413368 | 13221.8218 |
| Croatia | Europe | 1987 | 71.52000 | 4484310 | 13822.5839 |
| Croatia | Europe | 1992 | 72.52700 | 4494013 | 8447.7949 |
| Croatia | Europe | 1997 | 73.68000 | 4444595 | 9875.6045 |
| Croatia | Europe | 2002 | 74.87600 | 4481020 | 11628.3890 |
| Croatia | Europe | 2007 | 75.74800 | 4493312 | 14619.2227 |
| Cuba | Americas | 1952 | 59.42100 | 6007797 | 5586.5388 |
| Cuba | Americas | 1957 | 62.32500 | 6640752 | 6092.1744 |
| Cuba | Americas | 1962 | 65.24600 | 7254373 | 5180.7559 |
| Cuba | Americas | 1967 | 68.29000 | 8139332 | 5690.2680 |
| Cuba | Americas | 1972 | 70.72300 | 8831348 | 5305.4453 |
| Cuba | Americas | 1977 | 72.64900 | 9537988 | 6380.4950 |
| Cuba | Americas | 1982 | 73.71700 | 9789224 | 7316.9181 |
| Cuba | Americas | 1987 | 74.17400 | 10239839 | 7532.9248 |
| Cuba | Americas | 1992 | 74.41400 | 10723260 | 5592.8440 |
| Cuba | Americas | 1997 | 76.15100 | 10983007 | 5431.9904 |
| Cuba | Americas | 2002 | 77.15800 | 11226999 | 6340.6467 |
| Cuba | Americas | 2007 | 78.27300 | 11416987 | 8948.1029 |
| Czech Republic | Europe | 1952 | 66.87000 | 9125183 | 6876.1403 |
| Czech Republic | Europe | 1957 | 69.03000 | 9513758 | 8256.3439 |
| Czech Republic | Europe | 1962 | 69.90000 | 9620282 | 10136.8671 |
| Czech Republic | Europe | 1967 | 70.38000 | 9835109 | 11399.4449 |
| Czech Republic | Europe | 1972 | 70.29000 | 9862158 | 13108.4536 |
| Czech Republic | Europe | 1977 | 70.71000 | 10161915 | 14800.1606 |
| Czech Republic | Europe | 1982 | 70.96000 | 10303704 | 15377.2285 |
| Czech Republic | Europe | 1987 | 71.58000 | 10311597 | 16310.4434 |
| Czech Republic | Europe | 1992 | 72.40000 | 10315702 | 14297.0212 |
| Czech Republic | Europe | 1997 | 74.01000 | 10300707 | 16048.5142 |
| Czech Republic | Europe | 2002 | 75.51000 | 10256295 | 17596.2102 |
| Czech Republic | Europe | 2007 | 76.48600 | 10228744 | 22833.3085 |
| Denmark | Europe | 1952 | 70.78000 | 4334000 | 9692.3852 |
| Denmark | Europe | 1957 | 71.81000 | 4487831 | 11099.6593 |
| Denmark | Europe | 1962 | 72.35000 | 4646899 | 13583.3135 |
| Denmark | Europe | 1967 | 72.96000 | 4838800 | 15937.2112 |
| Denmark | Europe | 1972 | 73.47000 | 4991596 | 18866.2072 |
| Denmark | Europe | 1977 | 74.69000 | 5088419 | 20422.9015 |
| Denmark | Europe | 1982 | 74.63000 | 5117810 | 21688.0405 |
| Denmark | Europe | 1987 | 74.80000 | 5127024 | 25116.1758 |
| Denmark | Europe | 1992 | 75.33000 | 5171393 | 26406.7399 |
| Denmark | Europe | 1997 | 76.11000 | 5283663 | 29804.3457 |
| Denmark | Europe | 2002 | 77.18000 | 5374693 | 32166.5001 |
| Denmark | Europe | 2007 | 78.33200 | 5468120 | 35278.4187 |
| Djibouti | Africa | 1952 | 34.81200 | 63149 | 2669.5295 |
| Djibouti | Africa | 1957 | 37.32800 | 71851 | 2864.9691 |
| Djibouti | Africa | 1962 | 39.69300 | 89898 | 3020.9893 |
| Djibouti | Africa | 1967 | 42.07400 | 127617 | 3020.0505 |
| Djibouti | Africa | 1972 | 44.36600 | 178848 | 3694.2124 |
| Djibouti | Africa | 1977 | 46.51900 | 228694 | 3081.7610 |
| Djibouti | Africa | 1982 | 48.81200 | 305991 | 2879.4681 |
| Djibouti | Africa | 1987 | 50.04000 | 311025 | 2880.1026 |
| Djibouti | Africa | 1992 | 51.60400 | 384156 | 2377.1562 |
| Djibouti | Africa | 1997 | 53.15700 | 417908 | 1895.0170 |
| Djibouti | Africa | 2002 | 53.37300 | 447416 | 1908.2609 |
| Djibouti | Africa | 2007 | 54.79100 | 496374 | 2082.4816 |
| Dominican Republic | Americas | 1952 | 45.92800 | 2491346 | 1397.7171 |
| Dominican Republic | Americas | 1957 | 49.82800 | 2923186 | 1544.4030 |
| Dominican Republic | Americas | 1962 | 53.45900 | 3453434 | 1662.1374 |
| Dominican Republic | Americas | 1967 | 56.75100 | 4049146 | 1653.7230 |
| Dominican Republic | Americas | 1972 | 59.63100 | 4671329 | 2189.8745 |
| Dominican Republic | Americas | 1977 | 61.78800 | 5302800 | 2681.9889 |
| Dominican Republic | Americas | 1982 | 63.72700 | 5968349 | 2861.0924 |
| Dominican Republic | Americas | 1987 | 66.04600 | 6655297 | 2899.8422 |
| Dominican Republic | Americas | 1992 | 68.45700 | 7351181 | 3044.2142 |
| Dominican Republic | Americas | 1997 | 69.95700 | 7992357 | 3614.1013 |
| Dominican Republic | Americas | 2002 | 70.84700 | 8650322 | 4563.8082 |
| Dominican Republic | Americas | 2007 | 72.23500 | 9319622 | 6025.3748 |
| Ecuador | Americas | 1952 | 48.35700 | 3548753 | 3522.1107 |
| Ecuador | Americas | 1957 | 51.35600 | 4058385 | 3780.5467 |
| Ecuador | Americas | 1962 | 54.64000 | 4681707 | 4086.1141 |
| Ecuador | Americas | 1967 | 56.67800 | 5432424 | 4579.0742 |
| Ecuador | Americas | 1972 | 58.79600 | 6298651 | 5280.9947 |
| Ecuador | Americas | 1977 | 61.31000 | 7278866 | 6679.6233 |
| Ecuador | Americas | 1982 | 64.34200 | 8365850 | 7213.7913 |
| Ecuador | Americas | 1987 | 67.23100 | 9545158 | 6481.7770 |
| Ecuador | Americas | 1992 | 69.61300 | 10748394 | 7103.7026 |
| Ecuador | Americas | 1997 | 72.31200 | 11911819 | 7429.4559 |
| Ecuador | Americas | 2002 | 74.17300 | 12921234 | 5773.0445 |
| Ecuador | Americas | 2007 | 74.99400 | 13755680 | 6873.2623 |
| Egypt | Africa | 1952 | 41.89300 | 22223309 | 1418.8224 |
| Egypt | Africa | 1957 | 44.44400 | 25009741 | 1458.9153 |
| Egypt | Africa | 1962 | 46.99200 | 28173309 | 1693.3359 |
| Egypt | Africa | 1967 | 49.29300 | 31681188 | 1814.8807 |
| Egypt | Africa | 1972 | 51.13700 | 34807417 | 2024.0081 |
| Egypt | Africa | 1977 | 53.31900 | 38783863 | 2785.4936 |
| Egypt | Africa | 1982 | 56.00600 | 45681811 | 3503.7296 |
| Egypt | Africa | 1987 | 59.79700 | 52799062 | 3885.4607 |
| Egypt | Africa | 1992 | 63.67400 | 59402198 | 3794.7552 |
| Egypt | Africa | 1997 | 67.21700 | 66134291 | 4173.1818 |
| Egypt | Africa | 2002 | 69.80600 | 73312559 | 4754.6044 |
| Egypt | Africa | 2007 | 71.33800 | 80264543 | 5581.1810 |
| El Salvador | Americas | 1952 | 45.26200 | 2042865 | 3048.3029 |
| El Salvador | Americas | 1957 | 48.57000 | 2355805 | 3421.5232 |
| El Salvador | Americas | 1962 | 52.30700 | 2747687 | 3776.8036 |
| El Salvador | Americas | 1967 | 55.85500 | 3232927 | 4358.5954 |
| El Salvador | Americas | 1972 | 58.20700 | 3790903 | 4520.2460 |
| El Salvador | Americas | 1977 | 56.69600 | 4282586 | 5138.9224 |
| El Salvador | Americas | 1982 | 56.60400 | 4474873 | 4098.3442 |
| El Salvador | Americas | 1987 | 63.15400 | 4842194 | 4140.4421 |
| El Salvador | Americas | 1992 | 66.79800 | 5274649 | 4444.2317 |
| El Salvador | Americas | 1997 | 69.53500 | 5783439 | 5154.8255 |
| El Salvador | Americas | 2002 | 70.73400 | 6353681 | 5351.5687 |
| El Salvador | Americas | 2007 | 71.87800 | 6939688 | 5728.3535 |
| Equatorial Guinea | Africa | 1952 | 34.48200 | 216964 | 375.6431 |
| Equatorial Guinea | Africa | 1957 | 35.98300 | 232922 | 426.0964 |
| Equatorial Guinea | Africa | 1962 | 37.48500 | 249220 | 582.8420 |
| Equatorial Guinea | Africa | 1967 | 38.98700 | 259864 | 915.5960 |
| Equatorial Guinea | Africa | 1972 | 40.51600 | 277603 | 672.4123 |
| Equatorial Guinea | Africa | 1977 | 42.02400 | 192675 | 958.5668 |
| Equatorial Guinea | Africa | 1982 | 43.66200 | 285483 | 927.8253 |
| Equatorial Guinea | Africa | 1987 | 45.66400 | 341244 | 966.8968 |
| Equatorial Guinea | Africa | 1992 | 47.54500 | 387838 | 1132.0550 |
| Equatorial Guinea | Africa | 1997 | 48.24500 | 439971 | 2814.4808 |
| Equatorial Guinea | Africa | 2002 | 49.34800 | 495627 | 7703.4959 |
| Equatorial Guinea | Africa | 2007 | 51.57900 | 551201 | 12154.0897 |
| Eritrea | Africa | 1952 | 35.92800 | 1438760 | 328.9406 |
| Eritrea | Africa | 1957 | 38.04700 | 1542611 | 344.1619 |
| Eritrea | Africa | 1962 | 40.15800 | 1666618 | 380.9958 |
| Eritrea | Africa | 1967 | 42.18900 | 1820319 | 468.7950 |
| Eritrea | Africa | 1972 | 44.14200 | 2260187 | 514.3242 |
| Eritrea | Africa | 1977 | 44.53500 | 2512642 | 505.7538 |
| Eritrea | Africa | 1982 | 43.89000 | 2637297 | 524.8758 |
| Eritrea | Africa | 1987 | 46.45300 | 2915959 | 521.1341 |
| Eritrea | Africa | 1992 | 49.99100 | 3668440 | 582.8585 |
| Eritrea | Africa | 1997 | 53.37800 | 4058319 | 913.4708 |
| Eritrea | Africa | 2002 | 55.24000 | 4414865 | 765.3500 |
| Eritrea | Africa | 2007 | 58.04000 | 4906585 | 641.3695 |
| Ethiopia | Africa | 1952 | 34.07800 | 20860941 | 362.1463 |
| Ethiopia | Africa | 1957 | 36.66700 | 22815614 | 378.9042 |
| Ethiopia | Africa | 1962 | 40.05900 | 25145372 | 419.4564 |
| Ethiopia | Africa | 1967 | 42.11500 | 27860297 | 516.1186 |
| Ethiopia | Africa | 1972 | 43.51500 | 30770372 | 566.2439 |
| Ethiopia | Africa | 1977 | 44.51000 | 34617799 | 556.8084 |
| Ethiopia | Africa | 1982 | 44.91600 | 38111756 | 577.8607 |
| Ethiopia | Africa | 1987 | 46.68400 | 42999530 | 573.7413 |
| Ethiopia | Africa | 1992 | 48.09100 | 52088559 | 421.3535 |
| Ethiopia | Africa | 1997 | 49.40200 | 59861301 | 515.8894 |
| Ethiopia | Africa | 2002 | 50.72500 | 67946797 | 530.0535 |
| Ethiopia | Africa | 2007 | 52.94700 | 76511887 | 690.8056 |
| Finland | Europe | 1952 | 66.55000 | 4090500 | 6424.5191 |
| Finland | Europe | 1957 | 67.49000 | 4324000 | 7545.4154 |
| Finland | Europe | 1962 | 68.75000 | 4491443 | 9371.8426 |
| Finland | Europe | 1967 | 69.83000 | 4605744 | 10921.6363 |
| Finland | Europe | 1972 | 70.87000 | 4639657 | 14358.8759 |
| Finland | Europe | 1977 | 72.52000 | 4738902 | 15605.4228 |
| Finland | Europe | 1982 | 74.55000 | 4826933 | 18533.1576 |
| Finland | Europe | 1987 | 74.83000 | 4931729 | 21141.0122 |
| Finland | Europe | 1992 | 75.70000 | 5041039 | 20647.1650 |
| Finland | Europe | 1997 | 77.13000 | 5134406 | 23723.9502 |
| Finland | Europe | 2002 | 78.37000 | 5193039 | 28204.5906 |
| Finland | Europe | 2007 | 79.31300 | 5238460 | 33207.0844 |
| France | Europe | 1952 | 67.41000 | 42459667 | 7029.8093 |
| France | Europe | 1957 | 68.93000 | 44310863 | 8662.8349 |
| France | Europe | 1962 | 70.51000 | 47124000 | 10560.4855 |
| France | Europe | 1967 | 71.55000 | 49569000 | 12999.9177 |
| France | Europe | 1972 | 72.38000 | 51732000 | 16107.1917 |
| France | Europe | 1977 | 73.83000 | 53165019 | 18292.6351 |
| France | Europe | 1982 | 74.89000 | 54433565 | 20293.8975 |
| France | Europe | 1987 | 76.34000 | 55630100 | 22066.4421 |
| France | Europe | 1992 | 77.46000 | 57374179 | 24703.7961 |
| France | Europe | 1997 | 78.64000 | 58623428 | 25889.7849 |
| France | Europe | 2002 | 79.59000 | 59925035 | 28926.0323 |
| France | Europe | 2007 | 80.65700 | 61083916 | 30470.0167 |
| Gabon | Africa | 1952 | 37.00300 | 420702 | 4293.4765 |
| Gabon | Africa | 1957 | 38.99900 | 434904 | 4976.1981 |
| Gabon | Africa | 1962 | 40.48900 | 455661 | 6631.4592 |
| Gabon | Africa | 1967 | 44.59800 | 489004 | 8358.7620 |
| Gabon | Africa | 1972 | 48.69000 | 537977 | 11401.9484 |
| Gabon | Africa | 1977 | 52.79000 | 706367 | 21745.5733 |
| Gabon | Africa | 1982 | 56.56400 | 753874 | 15113.3619 |
| Gabon | Africa | 1987 | 60.19000 | 880397 | 11864.4084 |
| Gabon | Africa | 1992 | 61.36600 | 985739 | 13522.1575 |
| Gabon | Africa | 1997 | 60.46100 | 1126189 | 14722.8419 |
| Gabon | Africa | 2002 | 56.76100 | 1299304 | 12521.7139 |
| Gabon | Africa | 2007 | 56.73500 | 1454867 | 13206.4845 |
| Gambia | Africa | 1952 | 30.00000 | 284320 | 485.2307 |
| Gambia | Africa | 1957 | 32.06500 | 323150 | 520.9267 |
| Gambia | Africa | 1962 | 33.89600 | 374020 | 599.6503 |
| Gambia | Africa | 1967 | 35.85700 | 439593 | 734.7829 |
| Gambia | Africa | 1972 | 38.30800 | 517101 | 756.0868 |
| Gambia | Africa | 1977 | 41.84200 | 608274 | 884.7553 |
| Gambia | Africa | 1982 | 45.58000 | 715523 | 835.8096 |
| Gambia | Africa | 1987 | 49.26500 | 848406 | 611.6589 |
| Gambia | Africa | 1992 | 52.64400 | 1025384 | 665.6244 |
| Gambia | Africa | 1997 | 55.86100 | 1235767 | 653.7302 |
| Gambia | Africa | 2002 | 58.04100 | 1457766 | 660.5856 |
| Gambia | Africa | 2007 | 59.44800 | 1688359 | 752.7497 |
| Germany | Europe | 1952 | 67.50000 | 69145952 | 7144.1144 |
| Germany | Europe | 1957 | 69.10000 | 71019069 | 10187.8267 |
| Germany | Europe | 1962 | 70.30000 | 73739117 | 12902.4629 |
| Germany | Europe | 1967 | 70.80000 | 76368453 | 14745.6256 |
| Germany | Europe | 1972 | 71.00000 | 78717088 | 18016.1803 |
| Germany | Europe | 1977 | 72.50000 | 78160773 | 20512.9212 |
| Germany | Europe | 1982 | 73.80000 | 78335266 | 22031.5327 |
| Germany | Europe | 1987 | 74.84700 | 77718298 | 24639.1857 |
| Germany | Europe | 1992 | 76.07000 | 80597764 | 26505.3032 |
| Germany | Europe | 1997 | 77.34000 | 82011073 | 27788.8842 |
| Germany | Europe | 2002 | 78.67000 | 82350671 | 30035.8020 |
| Germany | Europe | 2007 | 79.40600 | 82400996 | 32170.3744 |
| Ghana | Africa | 1952 | 43.14900 | 5581001 | 911.2989 |
| Ghana | Africa | 1957 | 44.77900 | 6391288 | 1043.5615 |
| Ghana | Africa | 1962 | 46.45200 | 7355248 | 1190.0411 |
| Ghana | Africa | 1967 | 48.07200 | 8490213 | 1125.6972 |
| Ghana | Africa | 1972 | 49.87500 | 9354120 | 1178.2237 |
| Ghana | Africa | 1977 | 51.75600 | 10538093 | 993.2240 |
| Ghana | Africa | 1982 | 53.74400 | 11400338 | 876.0326 |
| Ghana | Africa | 1987 | 55.72900 | 14168101 | 847.0061 |
| Ghana | Africa | 1992 | 57.50100 | 16278738 | 925.0602 |
| Ghana | Africa | 1997 | 58.55600 | 18418288 | 1005.2458 |
| Ghana | Africa | 2002 | 58.45300 | 20550751 | 1111.9846 |
| Ghana | Africa | 2007 | 60.02200 | 22873338 | 1327.6089 |
| Greece | Europe | 1952 | 65.86000 | 7733250 | 3530.6901 |
| Greece | Europe | 1957 | 67.86000 | 8096218 | 4916.2999 |
| Greece | Europe | 1962 | 69.51000 | 8448233 | 6017.1907 |
| Greece | Europe | 1967 | 71.00000 | 8716441 | 8513.0970 |
| Greece | Europe | 1972 | 72.34000 | 8888628 | 12724.8296 |
| Greece | Europe | 1977 | 73.68000 | 9308479 | 14195.5243 |
| Greece | Europe | 1982 | 75.24000 | 9786480 | 15268.4209 |
| Greece | Europe | 1987 | 76.67000 | 9974490 | 16120.5284 |
| Greece | Europe | 1992 | 77.03000 | 10325429 | 17541.4963 |
| Greece | Europe | 1997 | 77.86900 | 10502372 | 18747.6981 |
| Greece | Europe | 2002 | 78.25600 | 10603863 | 22514.2548 |
| Greece | Europe | 2007 | 79.48300 | 10706290 | 27538.4119 |
| Guatemala | Americas | 1952 | 42.02300 | 3146381 | 2428.2378 |
| Guatemala | Americas | 1957 | 44.14200 | 3640876 | 2617.1560 |
| Guatemala | Americas | 1962 | 46.95400 | 4208858 | 2750.3644 |
| Guatemala | Americas | 1967 | 50.01600 | 4690773 | 3242.5311 |
| Guatemala | Americas | 1972 | 53.73800 | 5149581 | 4031.4083 |
| Guatemala | Americas | 1977 | 56.02900 | 5703430 | 4879.9927 |
| Guatemala | Americas | 1982 | 58.13700 | 6395630 | 4820.4948 |
| Guatemala | Americas | 1987 | 60.78200 | 7326406 | 4246.4860 |
| Guatemala | Americas | 1992 | 63.37300 | 8486949 | 4439.4508 |
| Guatemala | Americas | 1997 | 66.32200 | 9803875 | 4684.3138 |
| Guatemala | Americas | 2002 | 68.97800 | 11178650 | 4858.3475 |
| Guatemala | Americas | 2007 | 70.25900 | 12572928 | 5186.0500 |
| Guinea | Africa | 1952 | 33.60900 | 2664249 | 510.1965 |
| Guinea | Africa | 1957 | 34.55800 | 2876726 | 576.2670 |
| Guinea | Africa | 1962 | 35.75300 | 3140003 | 686.3737 |
| Guinea | Africa | 1967 | 37.19700 | 3451418 | 708.7595 |
| Guinea | Africa | 1972 | 38.84200 | 3811387 | 741.6662 |
| Guinea | Africa | 1977 | 40.76200 | 4227026 | 874.6859 |
| Guinea | Africa | 1982 | 42.89100 | 4710497 | 857.2504 |
| Guinea | Africa | 1987 | 45.55200 | 5650262 | 805.5725 |
| Guinea | Africa | 1992 | 48.57600 | 6990574 | 794.3484 |
| Guinea | Africa | 1997 | 51.45500 | 8048834 | 869.4498 |
| Guinea | Africa | 2002 | 53.67600 | 8807818 | 945.5836 |
| Guinea | Africa | 2007 | 56.00700 | 9947814 | 942.6542 |
| Guinea-Bissau | Africa | 1952 | 32.50000 | 580653 | 299.8503 |
| Guinea-Bissau | Africa | 1957 | 33.48900 | 601095 | 431.7905 |
| Guinea-Bissau | Africa | 1962 | 34.48800 | 627820 | 522.0344 |
| Guinea-Bissau | Africa | 1967 | 35.49200 | 601287 | 715.5806 |
| Guinea-Bissau | Africa | 1972 | 36.48600 | 625361 | 820.2246 |
| Guinea-Bissau | Africa | 1977 | 37.46500 | 745228 | 764.7260 |
| Guinea-Bissau | Africa | 1982 | 39.32700 | 825987 | 838.1240 |
| Guinea-Bissau | Africa | 1987 | 41.24500 | 927524 | 736.4154 |
| Guinea-Bissau | Africa | 1992 | 43.26600 | 1050938 | 745.5399 |
| Guinea-Bissau | Africa | 1997 | 44.87300 | 1193708 | 796.6645 |
| Guinea-Bissau | Africa | 2002 | 45.50400 | 1332459 | 575.7047 |
| Guinea-Bissau | Africa | 2007 | 46.38800 | 1472041 | 579.2317 |
| Haiti | Americas | 1952 | 37.57900 | 3201488 | 1840.3669 |
| Haiti | Americas | 1957 | 40.69600 | 3507701 | 1726.8879 |
| Haiti | Americas | 1962 | 43.59000 | 3880130 | 1796.5890 |
| Haiti | Americas | 1967 | 46.24300 | 4318137 | 1452.0577 |
| Haiti | Americas | 1972 | 48.04200 | 4698301 | 1654.4569 |
| Haiti | Americas | 1977 | 49.92300 | 4908554 | 1874.2989 |
| Haiti | Americas | 1982 | 51.46100 | 5198399 | 2011.1595 |
| Haiti | Americas | 1987 | 53.63600 | 5756203 | 1823.0160 |
| Haiti | Americas | 1992 | 55.08900 | 6326682 | 1456.3095 |
| Haiti | Americas | 1997 | 56.67100 | 6913545 | 1341.7269 |
| Haiti | Americas | 2002 | 58.13700 | 7607651 | 1270.3649 |
| Haiti | Americas | 2007 | 60.91600 | 8502814 | 1201.6372 |
| Honduras | Americas | 1952 | 41.91200 | 1517453 | 2194.9262 |
| Honduras | Americas | 1957 | 44.66500 | 1770390 | 2220.4877 |
| Honduras | Americas | 1962 | 48.04100 | 2090162 | 2291.1568 |
| Honduras | Americas | 1967 | 50.92400 | 2500689 | 2538.2694 |
| Honduras | Americas | 1972 | 53.88400 | 2965146 | 2529.8423 |
| Honduras | Americas | 1977 | 57.40200 | 3055235 | 3203.2081 |
| Honduras | Americas | 1982 | 60.90900 | 3669448 | 3121.7608 |
| Honduras | Americas | 1987 | 64.49200 | 4372203 | 3023.0967 |
| Honduras | Americas | 1992 | 66.39900 | 5077347 | 3081.6946 |
| Honduras | Americas | 1997 | 67.65900 | 5867957 | 3160.4549 |
| Honduras | Americas | 2002 | 68.56500 | 6677328 | 3099.7287 |
| Honduras | Americas | 2007 | 70.19800 | 7483763 | 3548.3308 |
| Hong Kong, China | Asia | 1952 | 60.96000 | 2125900 | 3054.4212 |
| Hong Kong, China | Asia | 1957 | 64.75000 | 2736300 | 3629.0765 |
| Hong Kong, China | Asia | 1962 | 67.65000 | 3305200 | 4692.6483 |
| Hong Kong, China | Asia | 1967 | 70.00000 | 3722800 | 6197.9628 |
| Hong Kong, China | Asia | 1972 | 72.00000 | 4115700 | 8315.9281 |
| Hong Kong, China | Asia | 1977 | 73.60000 | 4583700 | 11186.1413 |
| Hong Kong, China | Asia | 1982 | 75.45000 | 5264500 | 14560.5305 |
| Hong Kong, China | Asia | 1987 | 76.20000 | 5584510 | 20038.4727 |
| Hong Kong, China | Asia | 1992 | 77.60100 | 5829696 | 24757.6030 |
| Hong Kong, China | Asia | 1997 | 80.00000 | 6495918 | 28377.6322 |
| Hong Kong, China | Asia | 2002 | 81.49500 | 6762476 | 30209.0152 |
| Hong Kong, China | Asia | 2007 | 82.20800 | 6980412 | 39724.9787 |
| Hungary | Europe | 1952 | 64.03000 | 9504000 | 5263.6738 |
| Hungary | Europe | 1957 | 66.41000 | 9839000 | 6040.1800 |
| Hungary | Europe | 1962 | 67.96000 | 10063000 | 7550.3599 |
| Hungary | Europe | 1967 | 69.50000 | 10223422 | 9326.6447 |
| Hungary | Europe | 1972 | 69.76000 | 10394091 | 10168.6561 |
| Hungary | Europe | 1977 | 69.95000 | 10637171 | 11674.8374 |
| Hungary | Europe | 1982 | 69.39000 | 10705535 | 12545.9907 |
| Hungary | Europe | 1987 | 69.58000 | 10612740 | 12986.4800 |
| Hungary | Europe | 1992 | 69.17000 | 10348684 | 10535.6285 |
| Hungary | Europe | 1997 | 71.04000 | 10244684 | 11712.7768 |
| Hungary | Europe | 2002 | 72.59000 | 10083313 | 14843.9356 |
| Hungary | Europe | 2007 | 73.33800 | 9956108 | 18008.9444 |
| Iceland | Europe | 1952 | 72.49000 | 147962 | 7267.6884 |
| Iceland | Europe | 1957 | 73.47000 | 165110 | 9244.0014 |
| Iceland | Europe | 1962 | 73.68000 | 182053 | 10350.1591 |
| Iceland | Europe | 1967 | 73.73000 | 198676 | 13319.8957 |
| Iceland | Europe | 1972 | 74.46000 | 209275 | 15798.0636 |
| Iceland | Europe | 1977 | 76.11000 | 221823 | 19654.9625 |
| Iceland | Europe | 1982 | 76.99000 | 233997 | 23269.6075 |
| Iceland | Europe | 1987 | 77.23000 | 244676 | 26923.2063 |
| Iceland | Europe | 1992 | 78.77000 | 259012 | 25144.3920 |
| Iceland | Europe | 1997 | 78.95000 | 271192 | 28061.0997 |
| Iceland | Europe | 2002 | 80.50000 | 288030 | 31163.2020 |
| Iceland | Europe | 2007 | 81.75700 | 301931 | 36180.7892 |
| India | Asia | 1952 | 37.37300 | 372000000 | 546.5657 |
| India | Asia | 1957 | 40.24900 | 409000000 | 590.0620 |
| India | Asia | 1962 | 43.60500 | 454000000 | 658.3472 |
| India | Asia | 1967 | 47.19300 | 506000000 | 700.7706 |
| India | Asia | 1972 | 50.65100 | 567000000 | 724.0325 |
| India | Asia | 1977 | 54.20800 | 634000000 | 813.3373 |
| India | Asia | 1982 | 56.59600 | 708000000 | 855.7235 |
| India | Asia | 1987 | 58.55300 | 788000000 | 976.5127 |
| India | Asia | 1992 | 60.22300 | 872000000 | 1164.4068 |
| India | Asia | 1997 | 61.76500 | 959000000 | 1458.8174 |
| India | Asia | 2002 | 62.87900 | 1034172547 | 1746.7695 |
| India | Asia | 2007 | 64.69800 | 1110396331 | 2452.2104 |
| Indonesia | Asia | 1952 | 37.46800 | 82052000 | 749.6817 |
| Indonesia | Asia | 1957 | 39.91800 | 90124000 | 858.9003 |
| Indonesia | Asia | 1962 | 42.51800 | 99028000 | 849.2898 |
| Indonesia | Asia | 1967 | 45.96400 | 109343000 | 762.4318 |
| Indonesia | Asia | 1972 | 49.20300 | 121282000 | 1111.1079 |
| Indonesia | Asia | 1977 | 52.70200 | 136725000 | 1382.7021 |
| Indonesia | Asia | 1982 | 56.15900 | 153343000 | 1516.8730 |
| Indonesia | Asia | 1987 | 60.13700 | 169276000 | 1748.3570 |
| Indonesia | Asia | 1992 | 62.68100 | 184816000 | 2383.1409 |
| Indonesia | Asia | 1997 | 66.04100 | 199278000 | 3119.3356 |
| Indonesia | Asia | 2002 | 68.58800 | 211060000 | 2873.9129 |
| Indonesia | Asia | 2007 | 70.65000 | 223547000 | 3540.6516 |
| Iran | Asia | 1952 | 44.86900 | 17272000 | 3035.3260 |
| Iran | Asia | 1957 | 47.18100 | 19792000 | 3290.2576 |
| Iran | Asia | 1962 | 49.32500 | 22874000 | 4187.3298 |
| Iran | Asia | 1967 | 52.46900 | 26538000 | 5906.7318 |
| Iran | Asia | 1972 | 55.23400 | 30614000 | 9613.8186 |
| Iran | Asia | 1977 | 57.70200 | 35480679 | 11888.5951 |
| Iran | Asia | 1982 | 59.62000 | 43072751 | 7608.3346 |
| Iran | Asia | 1987 | 63.04000 | 51889696 | 6642.8814 |
| Iran | Asia | 1992 | 65.74200 | 60397973 | 7235.6532 |
| Iran | Asia | 1997 | 68.04200 | 63327987 | 8263.5903 |
| Iran | Asia | 2002 | 69.45100 | 66907826 | 9240.7620 |
| Iran | Asia | 2007 | 70.96400 | 69453570 | 11605.7145 |
| Iraq | Asia | 1952 | 45.32000 | 5441766 | 4129.7661 |
| Iraq | Asia | 1957 | 48.43700 | 6248643 | 6229.3336 |
| Iraq | Asia | 1962 | 51.45700 | 7240260 | 8341.7378 |
| Iraq | Asia | 1967 | 54.45900 | 8519282 | 8931.4598 |
| Iraq | Asia | 1972 | 56.95000 | 10061506 | 9576.0376 |
| Iraq | Asia | 1977 | 60.41300 | 11882916 | 14688.2351 |
| Iraq | Asia | 1982 | 62.03800 | 14173318 | 14517.9071 |
| Iraq | Asia | 1987 | 65.04400 | 16543189 | 11643.5727 |
| Iraq | Asia | 1992 | 59.46100 | 17861905 | 3745.6407 |
| Iraq | Asia | 1997 | 58.81100 | 20775703 | 3076.2398 |
| Iraq | Asia | 2002 | 57.04600 | 24001816 | 4390.7173 |
| Iraq | Asia | 2007 | 59.54500 | 27499638 | 4471.0619 |
| Ireland | Europe | 1952 | 66.91000 | 2952156 | 5210.2803 |
| Ireland | Europe | 1957 | 68.90000 | 2878220 | 5599.0779 |
| Ireland | Europe | 1962 | 70.29000 | 2830000 | 6631.5973 |
| Ireland | Europe | 1967 | 71.08000 | 2900100 | 7655.5690 |
| Ireland | Europe | 1972 | 71.28000 | 3024400 | 9530.7729 |
| Ireland | Europe | 1977 | 72.03000 | 3271900 | 11150.9811 |
| Ireland | Europe | 1982 | 73.10000 | 3480000 | 12618.3214 |
| Ireland | Europe | 1987 | 74.36000 | 3539900 | 13872.8665 |
| Ireland | Europe | 1992 | 75.46700 | 3557761 | 17558.8155 |
| Ireland | Europe | 1997 | 76.12200 | 3667233 | 24521.9471 |
| Ireland | Europe | 2002 | 77.78300 | 3879155 | 34077.0494 |
| Ireland | Europe | 2007 | 78.88500 | 4109086 | 40675.9964 |
| Israel | Asia | 1952 | 65.39000 | 1620914 | 4086.5221 |
| Israel | Asia | 1957 | 67.84000 | 1944401 | 5385.2785 |
| Israel | Asia | 1962 | 69.39000 | 2310904 | 7105.6307 |
| Israel | Asia | 1967 | 70.75000 | 2693585 | 8393.7414 |
| Israel | Asia | 1972 | 71.63000 | 3095893 | 12786.9322 |
| Israel | Asia | 1977 | 73.06000 | 3495918 | 13306.6192 |
| Israel | Asia | 1982 | 74.45000 | 3858421 | 15367.0292 |
| Israel | Asia | 1987 | 75.60000 | 4203148 | 17122.4799 |
| Israel | Asia | 1992 | 76.93000 | 4936550 | 18051.5225 |
| Israel | Asia | 1997 | 78.26900 | 5531387 | 20896.6092 |
| Israel | Asia | 2002 | 79.69600 | 6029529 | 21905.5951 |
| Israel | Asia | 2007 | 80.74500 | 6426679 | 25523.2771 |
| Italy | Europe | 1952 | 65.94000 | 47666000 | 4931.4042 |
| Italy | Europe | 1957 | 67.81000 | 49182000 | 6248.6562 |
| Italy | Europe | 1962 | 69.24000 | 50843200 | 8243.5823 |
| Italy | Europe | 1967 | 71.06000 | 52667100 | 10022.4013 |
| Italy | Europe | 1972 | 72.19000 | 54365564 | 12269.2738 |
| Italy | Europe | 1977 | 73.48000 | 56059245 | 14255.9847 |
| Italy | Europe | 1982 | 74.98000 | 56535636 | 16537.4835 |
| Italy | Europe | 1987 | 76.42000 | 56729703 | 19207.2348 |
| Italy | Europe | 1992 | 77.44000 | 56840847 | 22013.6449 |
| Italy | Europe | 1997 | 78.82000 | 57479469 | 24675.0245 |
| Italy | Europe | 2002 | 80.24000 | 57926999 | 27968.0982 |
| Italy | Europe | 2007 | 80.54600 | 58147733 | 28569.7197 |
| Jamaica | Americas | 1952 | 58.53000 | 1426095 | 2898.5309 |
| Jamaica | Americas | 1957 | 62.61000 | 1535090 | 4756.5258 |
| Jamaica | Americas | 1962 | 65.61000 | 1665128 | 5246.1075 |
| Jamaica | Americas | 1967 | 67.51000 | 1861096 | 6124.7035 |
| Jamaica | Americas | 1972 | 69.00000 | 1997616 | 7433.8893 |
| Jamaica | Americas | 1977 | 70.11000 | 2156814 | 6650.1956 |
| Jamaica | Americas | 1982 | 71.21000 | 2298309 | 6068.0513 |
| Jamaica | Americas | 1987 | 71.77000 | 2326606 | 6351.2375 |
| Jamaica | Americas | 1992 | 71.76600 | 2378618 | 7404.9237 |
| Jamaica | Americas | 1997 | 72.26200 | 2531311 | 7121.9247 |
| Jamaica | Americas | 2002 | 72.04700 | 2664659 | 6994.7749 |
| Jamaica | Americas | 2007 | 72.56700 | 2780132 | 7320.8803 |
| Japan | Asia | 1952 | 63.03000 | 86459025 | 3216.9563 |
| Japan | Asia | 1957 | 65.50000 | 91563009 | 4317.6944 |
| Japan | Asia | 1962 | 68.73000 | 95831757 | 6576.6495 |
| Japan | Asia | 1967 | 71.43000 | 100825279 | 9847.7886 |
| Japan | Asia | 1972 | 73.42000 | 107188273 | 14778.7864 |
| Japan | Asia | 1977 | 75.38000 | 113872473 | 16610.3770 |
| Japan | Asia | 1982 | 77.11000 | 118454974 | 19384.1057 |
| Japan | Asia | 1987 | 78.67000 | 122091325 | 22375.9419 |
| Japan | Asia | 1992 | 79.36000 | 124329269 | 26824.8951 |
| Japan | Asia | 1997 | 80.69000 | 125956499 | 28816.5850 |
| Japan | Asia | 2002 | 82.00000 | 127065841 | 28604.5919 |
| Japan | Asia | 2007 | 82.60300 | 127467972 | 31656.0681 |
| Jordan | Asia | 1952 | 43.15800 | 607914 | 1546.9078 |
| Jordan | Asia | 1957 | 45.66900 | 746559 | 1886.0806 |
| Jordan | Asia | 1962 | 48.12600 | 933559 | 2348.0092 |
| Jordan | Asia | 1967 | 51.62900 | 1255058 | 2741.7963 |
| Jordan | Asia | 1972 | 56.52800 | 1613551 | 2110.8563 |
| Jordan | Asia | 1977 | 61.13400 | 1937652 | 2852.3516 |
| Jordan | Asia | 1982 | 63.73900 | 2347031 | 4161.4160 |
| Jordan | Asia | 1987 | 65.86900 | 2820042 | 4448.6799 |
| Jordan | Asia | 1992 | 68.01500 | 3867409 | 3431.5936 |
| Jordan | Asia | 1997 | 69.77200 | 4526235 | 3645.3796 |
| Jordan | Asia | 2002 | 71.26300 | 5307470 | 3844.9172 |
| Jordan | Asia | 2007 | 72.53500 | 6053193 | 4519.4612 |
| Kenya | Africa | 1952 | 42.27000 | 6464046 | 853.5409 |
| Kenya | Africa | 1957 | 44.68600 | 7454779 | 944.4383 |
| Kenya | Africa | 1962 | 47.94900 | 8678557 | 896.9664 |
| Kenya | Africa | 1967 | 50.65400 | 10191512 | 1056.7365 |
| Kenya | Africa | 1972 | 53.55900 | 12044785 | 1222.3600 |
| Kenya | Africa | 1977 | 56.15500 | 14500404 | 1267.6132 |
| Kenya | Africa | 1982 | 58.76600 | 17661452 | 1348.2258 |
| Kenya | Africa | 1987 | 59.33900 | 21198082 | 1361.9369 |
| Kenya | Africa | 1992 | 59.28500 | 25020539 | 1341.9217 |
| Kenya | Africa | 1997 | 54.40700 | 28263827 | 1360.4850 |
| Kenya | Africa | 2002 | 50.99200 | 31386842 | 1287.5147 |
| Kenya | Africa | 2007 | 54.11000 | 35610177 | 1463.2493 |
| Korea, Dem. Rep. | Asia | 1952 | 50.05600 | 8865488 | 1088.2778 |
| Korea, Dem. Rep. | Asia | 1957 | 54.08100 | 9411381 | 1571.1347 |
| Korea, Dem. Rep. | Asia | 1962 | 56.65600 | 10917494 | 1621.6936 |
| Korea, Dem. Rep. | Asia | 1967 | 59.94200 | 12617009 | 2143.5406 |
| Korea, Dem. Rep. | Asia | 1972 | 63.98300 | 14781241 | 3701.6215 |
| Korea, Dem. Rep. | Asia | 1977 | 67.15900 | 16325320 | 4106.3012 |
| Korea, Dem. Rep. | Asia | 1982 | 69.10000 | 17647518 | 4106.5253 |
| Korea, Dem. Rep. | Asia | 1987 | 70.64700 | 19067554 | 4106.4923 |
| Korea, Dem. Rep. | Asia | 1992 | 69.97800 | 20711375 | 3726.0635 |
| Korea, Dem. Rep. | Asia | 1997 | 67.72700 | 21585105 | 1690.7568 |
| Korea, Dem. Rep. | Asia | 2002 | 66.66200 | 22215365 | 1646.7582 |
| Korea, Dem. Rep. | Asia | 2007 | 67.29700 | 23301725 | 1593.0655 |
| Korea, Rep. | Asia | 1952 | 47.45300 | 20947571 | 1030.5922 |
| Korea, Rep. | Asia | 1957 | 52.68100 | 22611552 | 1487.5935 |
| Korea, Rep. | Asia | 1962 | 55.29200 | 26420307 | 1536.3444 |
| Korea, Rep. | Asia | 1967 | 57.71600 | 30131000 | 2029.2281 |
| Korea, Rep. | Asia | 1972 | 62.61200 | 33505000 | 3030.8767 |
| Korea, Rep. | Asia | 1977 | 64.76600 | 36436000 | 4657.2210 |
| Korea, Rep. | Asia | 1982 | 67.12300 | 39326000 | 5622.9425 |
| Korea, Rep. | Asia | 1987 | 69.81000 | 41622000 | 8533.0888 |
| Korea, Rep. | Asia | 1992 | 72.24400 | 43805450 | 12104.2787 |
| Korea, Rep. | Asia | 1997 | 74.64700 | 46173816 | 15993.5280 |
| Korea, Rep. | Asia | 2002 | 77.04500 | 47969150 | 19233.9882 |
| Korea, Rep. | Asia | 2007 | 78.62300 | 49044790 | 23348.1397 |
| Kuwait | Asia | 1952 | 55.56500 | 160000 | 108382.3529 |
| Kuwait | Asia | 1957 | 58.03300 | 212846 | 113523.1329 |
| Kuwait | Asia | 1962 | 60.47000 | 358266 | 95458.1118 |
| Kuwait | Asia | 1967 | 64.62400 | 575003 | 80894.8833 |
| Kuwait | Asia | 1972 | 67.71200 | 841934 | 109347.8670 |
| Kuwait | Asia | 1977 | 69.34300 | 1140357 | 59265.4771 |
| Kuwait | Asia | 1982 | 71.30900 | 1497494 | 31354.0357 |
| Kuwait | Asia | 1987 | 74.17400 | 1891487 | 28118.4300 |
| Kuwait | Asia | 1992 | 75.19000 | 1418095 | 34932.9196 |
| Kuwait | Asia | 1997 | 76.15600 | 1765345 | 40300.6200 |
| Kuwait | Asia | 2002 | 76.90400 | 2111561 | 35110.1057 |
| Kuwait | Asia | 2007 | 77.58800 | 2505559 | 47306.9898 |
| Lebanon | Asia | 1952 | 55.92800 | 1439529 | 4834.8041 |
| Lebanon | Asia | 1957 | 59.48900 | 1647412 | 6089.7869 |
| Lebanon | Asia | 1962 | 62.09400 | 1886848 | 5714.5606 |
| Lebanon | Asia | 1967 | 63.87000 | 2186894 | 6006.9830 |
| Lebanon | Asia | 1972 | 65.42100 | 2680018 | 7486.3843 |
| Lebanon | Asia | 1977 | 66.09900 | 3115787 | 8659.6968 |
| Lebanon | Asia | 1982 | 66.98300 | 3086876 | 7640.5195 |
| Lebanon | Asia | 1987 | 67.92600 | 3089353 | 5377.0913 |
| Lebanon | Asia | 1992 | 69.29200 | 3219994 | 6890.8069 |
| Lebanon | Asia | 1997 | 70.26500 | 3430388 | 8754.9639 |
| Lebanon | Asia | 2002 | 71.02800 | 3677780 | 9313.9388 |
| Lebanon | Asia | 2007 | 71.99300 | 3921278 | 10461.0587 |
| Lesotho | Africa | 1952 | 42.13800 | 748747 | 298.8462 |
| Lesotho | Africa | 1957 | 45.04700 | 813338 | 335.9971 |
| Lesotho | Africa | 1962 | 47.74700 | 893143 | 411.8006 |
| Lesotho | Africa | 1967 | 48.49200 | 996380 | 498.6390 |
| Lesotho | Africa | 1972 | 49.76700 | 1116779 | 496.5816 |
| Lesotho | Africa | 1977 | 52.20800 | 1251524 | 745.3695 |
| Lesotho | Africa | 1982 | 55.07800 | 1411807 | 797.2631 |
| Lesotho | Africa | 1987 | 57.18000 | 1599200 | 773.9932 |
| Lesotho | Africa | 1992 | 59.68500 | 1803195 | 977.4863 |
| Lesotho | Africa | 1997 | 55.55800 | 1982823 | 1186.1480 |
| Lesotho | Africa | 2002 | 44.59300 | 2046772 | 1275.1846 |
| Lesotho | Africa | 2007 | 42.59200 | 2012649 | 1569.3314 |
| Liberia | Africa | 1952 | 38.48000 | 863308 | 575.5730 |
| Liberia | Africa | 1957 | 39.48600 | 975950 | 620.9700 |
| Liberia | Africa | 1962 | 40.50200 | 1112796 | 634.1952 |
| Liberia | Africa | 1967 | 41.53600 | 1279406 | 713.6036 |
| Liberia | Africa | 1972 | 42.61400 | 1482628 | 803.0055 |
| Liberia | Africa | 1977 | 43.76400 | 1703617 | 640.3224 |
| Liberia | Africa | 1982 | 44.85200 | 1956875 | 572.1996 |
| Liberia | Africa | 1987 | 46.02700 | 2269414 | 506.1139 |
| Liberia | Africa | 1992 | 40.80200 | 1912974 | 636.6229 |
| Liberia | Africa | 1997 | 42.22100 | 2200725 | 609.1740 |
| Liberia | Africa | 2002 | 43.75300 | 2814651 | 531.4824 |
| Liberia | Africa | 2007 | 45.67800 | 3193942 | 414.5073 |
| Libya | Africa | 1952 | 42.72300 | 1019729 | 2387.5481 |
| Libya | Africa | 1957 | 45.28900 | 1201578 | 3448.2844 |
| Libya | Africa | 1962 | 47.80800 | 1441863 | 6757.0308 |
| Libya | Africa | 1967 | 50.22700 | 1759224 | 18772.7517 |
| Libya | Africa | 1972 | 52.77300 | 2183877 | 21011.4972 |
| Libya | Africa | 1977 | 57.44200 | 2721783 | 21951.2118 |
| Libya | Africa | 1982 | 62.15500 | 3344074 | 17364.2754 |
| Libya | Africa | 1987 | 66.23400 | 3799845 | 11770.5898 |
| Libya | Africa | 1992 | 68.75500 | 4364501 | 9640.1385 |
| Libya | Africa | 1997 | 71.55500 | 4759670 | 9467.4461 |
| Libya | Africa | 2002 | 72.73700 | 5368585 | 9534.6775 |
| Libya | Africa | 2007 | 73.95200 | 6036914 | 12057.4993 |
| Madagascar | Africa | 1952 | 36.68100 | 4762912 | 1443.0117 |
| Madagascar | Africa | 1957 | 38.86500 | 5181679 | 1589.2027 |
| Madagascar | Africa | 1962 | 40.84800 | 5703324 | 1643.3871 |
| Madagascar | Africa | 1967 | 42.88100 | 6334556 | 1634.0473 |
| Madagascar | Africa | 1972 | 44.85100 | 7082430 | 1748.5630 |
| Madagascar | Africa | 1977 | 46.88100 | 8007166 | 1544.2286 |
| Madagascar | Africa | 1982 | 48.96900 | 9171477 | 1302.8787 |
| Madagascar | Africa | 1987 | 49.35000 | 10568642 | 1155.4419 |
| Madagascar | Africa | 1992 | 52.21400 | 12210395 | 1040.6762 |
| Madagascar | Africa | 1997 | 54.97800 | 14165114 | 986.2959 |
| Madagascar | Africa | 2002 | 57.28600 | 16473477 | 894.6371 |
| Madagascar | Africa | 2007 | 59.44300 | 19167654 | 1044.7701 |
| Malawi | Africa | 1952 | 36.25600 | 2917802 | 369.1651 |
| Malawi | Africa | 1957 | 37.20700 | 3221238 | 416.3698 |
| Malawi | Africa | 1962 | 38.41000 | 3628608 | 427.9011 |
| Malawi | Africa | 1967 | 39.48700 | 4147252 | 495.5148 |
| Malawi | Africa | 1972 | 41.76600 | 4730997 | 584.6220 |
| Malawi | Africa | 1977 | 43.76700 | 5637246 | 663.2237 |
| Malawi | Africa | 1982 | 45.64200 | 6502825 | 632.8039 |
| Malawi | Africa | 1987 | 47.45700 | 7824747 | 635.5174 |
| Malawi | Africa | 1992 | 49.42000 | 10014249 | 563.2000 |
| Malawi | Africa | 1997 | 47.49500 | 10419991 | 692.2758 |
| Malawi | Africa | 2002 | 45.00900 | 11824495 | 665.4231 |
| Malawi | Africa | 2007 | 48.30300 | 13327079 | 759.3499 |
| Malaysia | Asia | 1952 | 48.46300 | 6748378 | 1831.1329 |
| Malaysia | Asia | 1957 | 52.10200 | 7739235 | 1810.0670 |
| Malaysia | Asia | 1962 | 55.73700 | 8906385 | 2036.8849 |
| Malaysia | Asia | 1967 | 59.37100 | 10154878 | 2277.7424 |
| Malaysia | Asia | 1972 | 63.01000 | 11441462 | 2849.0948 |
| Malaysia | Asia | 1977 | 65.25600 | 12845381 | 3827.9216 |
| Malaysia | Asia | 1982 | 68.00000 | 14441916 | 4920.3560 |
| Malaysia | Asia | 1987 | 69.50000 | 16331785 | 5249.8027 |
| Malaysia | Asia | 1992 | 70.69300 | 18319502 | 7277.9128 |
| Malaysia | Asia | 1997 | 71.93800 | 20476091 | 10132.9096 |
| Malaysia | Asia | 2002 | 73.04400 | 22662365 | 10206.9779 |
| Malaysia | Asia | 2007 | 74.24100 | 24821286 | 12451.6558 |
| Mali | Africa | 1952 | 33.68500 | 3838168 | 452.3370 |
| Mali | Africa | 1957 | 35.30700 | 4241884 | 490.3822 |
| Mali | Africa | 1962 | 36.93600 | 4690372 | 496.1743 |
| Mali | Africa | 1967 | 38.48700 | 5212416 | 545.0099 |
| Mali | Africa | 1972 | 39.97700 | 5828158 | 581.3689 |
| Mali | Africa | 1977 | 41.71400 | 6491649 | 686.3953 |
| Mali | Africa | 1982 | 43.91600 | 6998256 | 618.0141 |
| Mali | Africa | 1987 | 46.36400 | 7634008 | 684.1716 |
| Mali | Africa | 1992 | 48.38800 | 8416215 | 739.0144 |
| Mali | Africa | 1997 | 49.90300 | 9384984 | 790.2580 |
| Mali | Africa | 2002 | 51.81800 | 10580176 | 951.4098 |
| Mali | Africa | 2007 | 54.46700 | 12031795 | 1042.5816 |
| Mauritania | Africa | 1952 | 40.54300 | 1022556 | 743.1159 |
| Mauritania | Africa | 1957 | 42.33800 | 1076852 | 846.1203 |
| Mauritania | Africa | 1962 | 44.24800 | 1146757 | 1055.8960 |
| Mauritania | Africa | 1967 | 46.28900 | 1230542 | 1421.1452 |
| Mauritania | Africa | 1972 | 48.43700 | 1332786 | 1586.8518 |
| Mauritania | Africa | 1977 | 50.85200 | 1456688 | 1497.4922 |
| Mauritania | Africa | 1982 | 53.59900 | 1622136 | 1481.1502 |
| Mauritania | Africa | 1987 | 56.14500 | 1841240 | 1421.6036 |
| Mauritania | Africa | 1992 | 58.33300 | 2119465 | 1361.3698 |
| Mauritania | Africa | 1997 | 60.43000 | 2444741 | 1483.1361 |
| Mauritania | Africa | 2002 | 62.24700 | 2828858 | 1579.0195 |
| Mauritania | Africa | 2007 | 64.16400 | 3270065 | 1803.1515 |
| Mauritius | Africa | 1952 | 50.98600 | 516556 | 1967.9557 |
| Mauritius | Africa | 1957 | 58.08900 | 609816 | 2034.0380 |
| Mauritius | Africa | 1962 | 60.24600 | 701016 | 2529.0675 |
| Mauritius | Africa | 1967 | 61.55700 | 789309 | 2475.3876 |
| Mauritius | Africa | 1972 | 62.94400 | 851334 | 2575.4842 |
| Mauritius | Africa | 1977 | 64.93000 | 913025 | 3710.9830 |
| Mauritius | Africa | 1982 | 66.71100 | 992040 | 3688.0377 |
| Mauritius | Africa | 1987 | 68.74000 | 1042663 | 4783.5869 |
| Mauritius | Africa | 1992 | 69.74500 | 1096202 | 6058.2538 |
| Mauritius | Africa | 1997 | 70.73600 | 1149818 | 7425.7053 |
| Mauritius | Africa | 2002 | 71.95400 | 1200206 | 9021.8159 |
| Mauritius | Africa | 2007 | 72.80100 | 1250882 | 10956.9911 |
| Mexico | Americas | 1952 | 50.78900 | 30144317 | 3478.1255 |
| Mexico | Americas | 1957 | 55.19000 | 35015548 | 4131.5466 |
| Mexico | Americas | 1962 | 58.29900 | 41121485 | 4581.6094 |
| Mexico | Americas | 1967 | 60.11000 | 47995559 | 5754.7339 |
| Mexico | Americas | 1972 | 62.36100 | 55984294 | 6809.4067 |
| Mexico | Americas | 1977 | 65.03200 | 63759976 | 7674.9291 |
| Mexico | Americas | 1982 | 67.40500 | 71640904 | 9611.1475 |
| Mexico | Americas | 1987 | 69.49800 | 80122492 | 8688.1560 |
| Mexico | Americas | 1992 | 71.45500 | 88111030 | 9472.3843 |
| Mexico | Americas | 1997 | 73.67000 | 95895146 | 9767.2975 |
| Mexico | Americas | 2002 | 74.90200 | 102479927 | 10742.4405 |
| Mexico | Americas | 2007 | 76.19500 | 108700891 | 11977.5750 |
| Mongolia | Asia | 1952 | 42.24400 | 800663 | 786.5669 |
| Mongolia | Asia | 1957 | 45.24800 | 882134 | 912.6626 |
| Mongolia | Asia | 1962 | 48.25100 | 1010280 | 1056.3540 |
| Mongolia | Asia | 1967 | 51.25300 | 1149500 | 1226.0411 |
| Mongolia | Asia | 1972 | 53.75400 | 1320500 | 1421.7420 |
| Mongolia | Asia | 1977 | 55.49100 | 1528000 | 1647.5117 |
| Mongolia | Asia | 1982 | 57.48900 | 1756032 | 2000.6031 |
| Mongolia | Asia | 1987 | 60.22200 | 2015133 | 2338.0083 |
| Mongolia | Asia | 1992 | 61.27100 | 2312802 | 1785.4020 |
| Mongolia | Asia | 1997 | 63.62500 | 2494803 | 1902.2521 |
| Mongolia | Asia | 2002 | 65.03300 | 2674234 | 2140.7393 |
| Mongolia | Asia | 2007 | 66.80300 | 2874127 | 3095.7723 |
| Montenegro | Europe | 1952 | 59.16400 | 413834 | 2647.5856 |
| Montenegro | Europe | 1957 | 61.44800 | 442829 | 3682.2599 |
| Montenegro | Europe | 1962 | 63.72800 | 474528 | 4649.5938 |
| Montenegro | Europe | 1967 | 67.17800 | 501035 | 5907.8509 |
| Montenegro | Europe | 1972 | 70.63600 | 527678 | 7778.4140 |
| Montenegro | Europe | 1977 | 73.06600 | 560073 | 9595.9299 |
| Montenegro | Europe | 1982 | 74.10100 | 562548 | 11222.5876 |
| Montenegro | Europe | 1987 | 74.86500 | 569473 | 11732.5102 |
| Montenegro | Europe | 1992 | 75.43500 | 621621 | 7003.3390 |
| Montenegro | Europe | 1997 | 75.44500 | 692651 | 6465.6133 |
| Montenegro | Europe | 2002 | 73.98100 | 720230 | 6557.1943 |
| Montenegro | Europe | 2007 | 74.54300 | 684736 | 9253.8961 |
| Morocco | Africa | 1952 | 42.87300 | 9939217 | 1688.2036 |
| Morocco | Africa | 1957 | 45.42300 | 11406350 | 1642.0023 |
| Morocco | Africa | 1962 | 47.92400 | 13056604 | 1566.3535 |
| Morocco | Africa | 1967 | 50.33500 | 14770296 | 1711.0448 |
| Morocco | Africa | 1972 | 52.86200 | 16660670 | 1930.1950 |
| Morocco | Africa | 1977 | 55.73000 | 18396941 | 2370.6200 |
| Morocco | Africa | 1982 | 59.65000 | 20198730 | 2702.6204 |
| Morocco | Africa | 1987 | 62.67700 | 22987397 | 2755.0470 |
| Morocco | Africa | 1992 | 65.39300 | 25798239 | 2948.0473 |
| Morocco | Africa | 1997 | 67.66000 | 28529501 | 2982.1019 |
| Morocco | Africa | 2002 | 69.61500 | 31167783 | 3258.4956 |
| Morocco | Africa | 2007 | 71.16400 | 33757175 | 3820.1752 |
| Mozambique | Africa | 1952 | 31.28600 | 6446316 | 468.5260 |
| Mozambique | Africa | 1957 | 33.77900 | 7038035 | 495.5868 |
| Mozambique | Africa | 1962 | 36.16100 | 7788944 | 556.6864 |
| Mozambique | Africa | 1967 | 38.11300 | 8680909 | 566.6692 |
| Mozambique | Africa | 1972 | 40.32800 | 9809596 | 724.9178 |
| Mozambique | Africa | 1977 | 42.49500 | 11127868 | 502.3197 |
| Mozambique | Africa | 1982 | 42.79500 | 12587223 | 462.2114 |
| Mozambique | Africa | 1987 | 42.86100 | 12891952 | 389.8762 |
| Mozambique | Africa | 1992 | 44.28400 | 13160731 | 410.8968 |
| Mozambique | Africa | 1997 | 46.34400 | 16603334 | 472.3461 |
| Mozambique | Africa | 2002 | 44.02600 | 18473780 | 633.6179 |
| Mozambique | Africa | 2007 | 42.08200 | 19951656 | 823.6856 |
| Myanmar | Asia | 1952 | 36.31900 | 20092996 | 331.0000 |
| Myanmar | Asia | 1957 | 41.90500 | 21731844 | 350.0000 |
| Myanmar | Asia | 1962 | 45.10800 | 23634436 | 388.0000 |
| Myanmar | Asia | 1967 | 49.37900 | 25870271 | 349.0000 |
| Myanmar | Asia | 1972 | 53.07000 | 28466390 | 357.0000 |
| Myanmar | Asia | 1977 | 56.05900 | 31528087 | 371.0000 |
| Myanmar | Asia | 1982 | 58.05600 | 34680442 | 424.0000 |
| Myanmar | Asia | 1987 | 58.33900 | 38028578 | 385.0000 |
| Myanmar | Asia | 1992 | 59.32000 | 40546538 | 347.0000 |
| Myanmar | Asia | 1997 | 60.32800 | 43247867 | 415.0000 |
| Myanmar | Asia | 2002 | 59.90800 | 45598081 | 611.0000 |
| Myanmar | Asia | 2007 | 62.06900 | 47761980 | 944.0000 |
| Namibia | Africa | 1952 | 41.72500 | 485831 | 2423.7804 |
| Namibia | Africa | 1957 | 45.22600 | 548080 | 2621.4481 |
| Namibia | Africa | 1962 | 48.38600 | 621392 | 3173.2156 |
| Namibia | Africa | 1967 | 51.15900 | 706640 | 3793.6948 |
| Namibia | Africa | 1972 | 53.86700 | 821782 | 3746.0809 |
| Namibia | Africa | 1977 | 56.43700 | 977026 | 3876.4860 |
| Namibia | Africa | 1982 | 58.96800 | 1099010 | 4191.1005 |
| Namibia | Africa | 1987 | 60.83500 | 1278184 | 3693.7313 |
| Namibia | Africa | 1992 | 61.99900 | 1554253 | 3804.5380 |
| Namibia | Africa | 1997 | 58.90900 | 1774766 | 3899.5243 |
| Namibia | Africa | 2002 | 51.47900 | 1972153 | 4072.3248 |
| Namibia | Africa | 2007 | 52.90600 | 2055080 | 4811.0604 |
| Nepal | Asia | 1952 | 36.15700 | 9182536 | 545.8657 |
| Nepal | Asia | 1957 | 37.68600 | 9682338 | 597.9364 |
| Nepal | Asia | 1962 | 39.39300 | 10332057 | 652.3969 |
| Nepal | Asia | 1967 | 41.47200 | 11261690 | 676.4422 |
| Nepal | Asia | 1972 | 43.97100 | 12412593 | 674.7881 |
| Nepal | Asia | 1977 | 46.74800 | 13933198 | 694.1124 |
| Nepal | Asia | 1982 | 49.59400 | 15796314 | 718.3731 |
| Nepal | Asia | 1987 | 52.53700 | 17917180 | 775.6325 |
| Nepal | Asia | 1992 | 55.72700 | 20326209 | 897.7404 |
| Nepal | Asia | 1997 | 59.42600 | 23001113 | 1010.8921 |
| Nepal | Asia | 2002 | 61.34000 | 25873917 | 1057.2063 |
| Nepal | Asia | 2007 | 63.78500 | 28901790 | 1091.3598 |
| Netherlands | Europe | 1952 | 72.13000 | 10381988 | 8941.5719 |
| Netherlands | Europe | 1957 | 72.99000 | 11026383 | 11276.1934 |
| Netherlands | Europe | 1962 | 73.23000 | 11805689 | 12790.8496 |
| Netherlands | Europe | 1967 | 73.82000 | 12596822 | 15363.2514 |
| Netherlands | Europe | 1972 | 73.75000 | 13329874 | 18794.7457 |
| Netherlands | Europe | 1977 | 75.24000 | 13852989 | 21209.0592 |
| Netherlands | Europe | 1982 | 76.05000 | 14310401 | 21399.4605 |
| Netherlands | Europe | 1987 | 76.83000 | 14665278 | 23651.3236 |
| Netherlands | Europe | 1992 | 77.42000 | 15174244 | 26790.9496 |
| Netherlands | Europe | 1997 | 78.03000 | 15604464 | 30246.1306 |
| Netherlands | Europe | 2002 | 78.53000 | 16122830 | 33724.7578 |
| Netherlands | Europe | 2007 | 79.76200 | 16570613 | 36797.9333 |
| New Zealand | Oceania | 1952 | 69.39000 | 1994794 | 10556.5757 |
| New Zealand | Oceania | 1957 | 70.26000 | 2229407 | 12247.3953 |
| New Zealand | Oceania | 1962 | 71.24000 | 2488550 | 13175.6780 |
| New Zealand | Oceania | 1967 | 71.52000 | 2728150 | 14463.9189 |
| New Zealand | Oceania | 1972 | 71.89000 | 2929100 | 16046.0373 |
| New Zealand | Oceania | 1977 | 72.22000 | 3164900 | 16233.7177 |
| New Zealand | Oceania | 1982 | 73.84000 | 3210650 | 17632.4104 |
| New Zealand | Oceania | 1987 | 74.32000 | 3317166 | 19007.1913 |
| New Zealand | Oceania | 1992 | 76.33000 | 3437674 | 18363.3249 |
| New Zealand | Oceania | 1997 | 77.55000 | 3676187 | 21050.4138 |
| New Zealand | Oceania | 2002 | 79.11000 | 3908037 | 23189.8014 |
| New Zealand | Oceania | 2007 | 80.20400 | 4115771 | 25185.0091 |
| Nicaragua | Americas | 1952 | 42.31400 | 1165790 | 3112.3639 |
| Nicaragua | Americas | 1957 | 45.43200 | 1358828 | 3457.4159 |
| Nicaragua | Americas | 1962 | 48.63200 | 1590597 | 3634.3644 |
| Nicaragua | Americas | 1967 | 51.88400 | 1865490 | 4643.3935 |
| Nicaragua | Americas | 1972 | 55.15100 | 2182908 | 4688.5933 |
| Nicaragua | Americas | 1977 | 57.47000 | 2554598 | 5486.3711 |
| Nicaragua | Americas | 1982 | 59.29800 | 2979423 | 3470.3382 |
| Nicaragua | Americas | 1987 | 62.00800 | 3344353 | 2955.9844 |
| Nicaragua | Americas | 1992 | 65.84300 | 4017939 | 2170.1517 |
| Nicaragua | Americas | 1997 | 68.42600 | 4609572 | 2253.0230 |
| Nicaragua | Americas | 2002 | 70.83600 | 5146848 | 2474.5488 |
| Nicaragua | Americas | 2007 | 72.89900 | 5675356 | 2749.3210 |
| Niger | Africa | 1952 | 37.44400 | 3379468 | 761.8794 |
| Niger | Africa | 1957 | 38.59800 | 3692184 | 835.5234 |
| Niger | Africa | 1962 | 39.48700 | 4076008 | 997.7661 |
| Niger | Africa | 1967 | 40.11800 | 4534062 | 1054.3849 |
| Niger | Africa | 1972 | 40.54600 | 5060262 | 954.2092 |
| Niger | Africa | 1977 | 41.29100 | 5682086 | 808.8971 |
| Niger | Africa | 1982 | 42.59800 | 6437188 | 909.7221 |
| Niger | Africa | 1987 | 44.55500 | 7332638 | 668.3000 |
| Niger | Africa | 1992 | 47.39100 | 8392818 | 581.1827 |
| Niger | Africa | 1997 | 51.31300 | 9666252 | 580.3052 |
| Niger | Africa | 2002 | 54.49600 | 11140655 | 601.0745 |
| Niger | Africa | 2007 | 56.86700 | 12894865 | 619.6769 |
| Nigeria | Africa | 1952 | 36.32400 | 33119096 | 1077.2819 |
| Nigeria | Africa | 1957 | 37.80200 | 37173340 | 1100.5926 |
| Nigeria | Africa | 1962 | 39.36000 | 41871351 | 1150.9275 |
| Nigeria | Africa | 1967 | 41.04000 | 47287752 | 1014.5141 |
| Nigeria | Africa | 1972 | 42.82100 | 53740085 | 1698.3888 |
| Nigeria | Africa | 1977 | 44.51400 | 62209173 | 1981.9518 |
| Nigeria | Africa | 1982 | 45.82600 | 73039376 | 1576.9738 |
| Nigeria | Africa | 1987 | 46.88600 | 81551520 | 1385.0296 |
| Nigeria | Africa | 1992 | 47.47200 | 93364244 | 1619.8482 |
| Nigeria | Africa | 1997 | 47.46400 | 106207839 | 1624.9413 |
| Nigeria | Africa | 2002 | 46.60800 | 119901274 | 1615.2864 |
| Nigeria | Africa | 2007 | 46.85900 | 135031164 | 2013.9773 |
| Norway | Europe | 1952 | 72.67000 | 3327728 | 10095.4217 |
| Norway | Europe | 1957 | 73.44000 | 3491938 | 11653.9730 |
| Norway | Europe | 1962 | 73.47000 | 3638919 | 13450.4015 |
| Norway | Europe | 1967 | 74.08000 | 3786019 | 16361.8765 |
| Norway | Europe | 1972 | 74.34000 | 3933004 | 18965.0555 |
| Norway | Europe | 1977 | 75.37000 | 4043205 | 23311.3494 |
| Norway | Europe | 1982 | 75.97000 | 4114787 | 26298.6353 |
| Norway | Europe | 1987 | 75.89000 | 4186147 | 31540.9748 |
| Norway | Europe | 1992 | 77.32000 | 4286357 | 33965.6611 |
| Norway | Europe | 1997 | 78.32000 | 4405672 | 41283.1643 |
| Norway | Europe | 2002 | 79.05000 | 4535591 | 44683.9753 |
| Norway | Europe | 2007 | 80.19600 | 4627926 | 49357.1902 |
| Oman | Asia | 1952 | 37.57800 | 507833 | 1828.2303 |
| Oman | Asia | 1957 | 40.08000 | 561977 | 2242.7466 |
| Oman | Asia | 1962 | 43.16500 | 628164 | 2924.6381 |
| Oman | Asia | 1967 | 46.98800 | 714775 | 4720.9427 |
| Oman | Asia | 1972 | 52.14300 | 829050 | 10618.0385 |
| Oman | Asia | 1977 | 57.36700 | 1004533 | 11848.3439 |
| Oman | Asia | 1982 | 62.72800 | 1301048 | 12954.7910 |
| Oman | Asia | 1987 | 67.73400 | 1593882 | 18115.2231 |
| Oman | Asia | 1992 | 71.19700 | 1915208 | 18616.7069 |
| Oman | Asia | 1997 | 72.49900 | 2283635 | 19702.0558 |
| Oman | Asia | 2002 | 74.19300 | 2713462 | 19774.8369 |
| Oman | Asia | 2007 | 75.64000 | 3204897 | 22316.1929 |
| Pakistan | Asia | 1952 | 43.43600 | 41346560 | 684.5971 |
| Pakistan | Asia | 1957 | 45.55700 | 46679944 | 747.0835 |
| Pakistan | Asia | 1962 | 47.67000 | 53100671 | 803.3427 |
| Pakistan | Asia | 1967 | 49.80000 | 60641899 | 942.4083 |
| Pakistan | Asia | 1972 | 51.92900 | 69325921 | 1049.9390 |
| Pakistan | Asia | 1977 | 54.04300 | 78152686 | 1175.9212 |
| Pakistan | Asia | 1982 | 56.15800 | 91462088 | 1443.4298 |
| Pakistan | Asia | 1987 | 58.24500 | 105186881 | 1704.6866 |
| Pakistan | Asia | 1992 | 60.83800 | 120065004 | 1971.8295 |
| Pakistan | Asia | 1997 | 61.81800 | 135564834 | 2049.3505 |
| Pakistan | Asia | 2002 | 63.61000 | 153403524 | 2092.7124 |
| Pakistan | Asia | 2007 | 65.48300 | 169270617 | 2605.9476 |
| Panama | Americas | 1952 | 55.19100 | 940080 | 2480.3803 |
| Panama | Americas | 1957 | 59.20100 | 1063506 | 2961.8009 |
| Panama | Americas | 1962 | 61.81700 | 1215725 | 3536.5403 |
| Panama | Americas | 1967 | 64.07100 | 1405486 | 4421.0091 |
| Panama | Americas | 1972 | 66.21600 | 1616384 | 5364.2497 |
| Panama | Americas | 1977 | 68.68100 | 1839782 | 5351.9121 |
| Panama | Americas | 1982 | 70.47200 | 2036305 | 7009.6016 |
| Panama | Americas | 1987 | 71.52300 | 2253639 | 7034.7792 |
| Panama | Americas | 1992 | 72.46200 | 2484997 | 6618.7431 |
| Panama | Americas | 1997 | 73.73800 | 2734531 | 7113.6923 |
| Panama | Americas | 2002 | 74.71200 | 2990875 | 7356.0319 |
| Panama | Americas | 2007 | 75.53700 | 3242173 | 9809.1856 |
| Paraguay | Americas | 1952 | 62.64900 | 1555876 | 1952.3087 |
| Paraguay | Americas | 1957 | 63.19600 | 1770902 | 2046.1547 |
| Paraguay | Americas | 1962 | 64.36100 | 2009813 | 2148.0271 |
| Paraguay | Americas | 1967 | 64.95100 | 2287985 | 2299.3763 |
| Paraguay | Americas | 1972 | 65.81500 | 2614104 | 2523.3380 |
| Paraguay | Americas | 1977 | 66.35300 | 2984494 | 3248.3733 |
| Paraguay | Americas | 1982 | 66.87400 | 3366439 | 4258.5036 |
| Paraguay | Americas | 1987 | 67.37800 | 3886512 | 3998.8757 |
| Paraguay | Americas | 1992 | 68.22500 | 4483945 | 4196.4111 |
| Paraguay | Americas | 1997 | 69.40000 | 5154123 | 4247.4003 |
| Paraguay | Americas | 2002 | 70.75500 | 5884491 | 3783.6742 |
| Paraguay | Americas | 2007 | 71.75200 | 6667147 | 4172.8385 |
| Peru | Americas | 1952 | 43.90200 | 8025700 | 3758.5234 |
| Peru | Americas | 1957 | 46.26300 | 9146100 | 4245.2567 |
| Peru | Americas | 1962 | 49.09600 | 10516500 | 4957.0380 |
| Peru | Americas | 1967 | 51.44500 | 12132200 | 5788.0933 |
| Peru | Americas | 1972 | 55.44800 | 13954700 | 5937.8273 |
| Peru | Americas | 1977 | 58.44700 | 15990099 | 6281.2909 |
| Peru | Americas | 1982 | 61.40600 | 18125129 | 6434.5018 |
| Peru | Americas | 1987 | 64.13400 | 20195924 | 6360.9434 |
| Peru | Americas | 1992 | 66.45800 | 22430449 | 4446.3809 |
| Peru | Americas | 1997 | 68.38600 | 24748122 | 5838.3477 |
| Peru | Americas | 2002 | 69.90600 | 26769436 | 5909.0201 |
| Peru | Americas | 2007 | 71.42100 | 28674757 | 7408.9056 |
| Philippines | Asia | 1952 | 47.75200 | 22438691 | 1272.8810 |
| Philippines | Asia | 1957 | 51.33400 | 26072194 | 1547.9448 |
| Philippines | Asia | 1962 | 54.75700 | 30325264 | 1649.5522 |
| Philippines | Asia | 1967 | 56.39300 | 35356600 | 1814.1274 |
| Philippines | Asia | 1972 | 58.06500 | 40850141 | 1989.3741 |
| Philippines | Asia | 1977 | 60.06000 | 46850962 | 2373.2043 |
| Philippines | Asia | 1982 | 62.08200 | 53456774 | 2603.2738 |
| Philippines | Asia | 1987 | 64.15100 | 60017788 | 2189.6350 |
| Philippines | Asia | 1992 | 66.45800 | 67185766 | 2279.3240 |
| Philippines | Asia | 1997 | 68.56400 | 75012988 | 2536.5349 |
| Philippines | Asia | 2002 | 70.30300 | 82995088 | 2650.9211 |
| Philippines | Asia | 2007 | 71.68800 | 91077287 | 3190.4810 |
| Poland | Europe | 1952 | 61.31000 | 25730551 | 4029.3297 |
| Poland | Europe | 1957 | 65.77000 | 28235346 | 4734.2530 |
| Poland | Europe | 1962 | 67.64000 | 30329617 | 5338.7521 |
| Poland | Europe | 1967 | 69.61000 | 31785378 | 6557.1528 |
| Poland | Europe | 1972 | 70.85000 | 33039545 | 8006.5070 |
| Poland | Europe | 1977 | 70.67000 | 34621254 | 9508.1415 |
| Poland | Europe | 1982 | 71.32000 | 36227381 | 8451.5310 |
| Poland | Europe | 1987 | 70.98000 | 37740710 | 9082.3512 |
| Poland | Europe | 1992 | 70.99000 | 38370697 | 7738.8812 |
| Poland | Europe | 1997 | 72.75000 | 38654957 | 10159.5837 |
| Poland | Europe | 2002 | 74.67000 | 38625976 | 12002.2391 |
| Poland | Europe | 2007 | 75.56300 | 38518241 | 15389.9247 |
| Portugal | Europe | 1952 | 59.82000 | 8526050 | 3068.3199 |
| Portugal | Europe | 1957 | 61.51000 | 8817650 | 3774.5717 |
| Portugal | Europe | 1962 | 64.39000 | 9019800 | 4727.9549 |
| Portugal | Europe | 1967 | 66.60000 | 9103000 | 6361.5180 |
| Portugal | Europe | 1972 | 69.26000 | 8970450 | 9022.2474 |
| Portugal | Europe | 1977 | 70.41000 | 9662600 | 10172.4857 |
| Portugal | Europe | 1982 | 72.77000 | 9859650 | 11753.8429 |
| Portugal | Europe | 1987 | 74.06000 | 9915289 | 13039.3088 |
| Portugal | Europe | 1992 | 74.86000 | 9927680 | 16207.2666 |
| Portugal | Europe | 1997 | 75.97000 | 10156415 | 17641.0316 |
| Portugal | Europe | 2002 | 77.29000 | 10433867 | 19970.9079 |
| Portugal | Europe | 2007 | 78.09800 | 10642836 | 20509.6478 |
| Puerto Rico | Americas | 1952 | 64.28000 | 2227000 | 3081.9598 |
| Puerto Rico | Americas | 1957 | 68.54000 | 2260000 | 3907.1562 |
| Puerto Rico | Americas | 1962 | 69.62000 | 2448046 | 5108.3446 |
| Puerto Rico | Americas | 1967 | 71.10000 | 2648961 | 6929.2777 |
| Puerto Rico | Americas | 1972 | 72.16000 | 2847132 | 9123.0417 |
| Puerto Rico | Americas | 1977 | 73.44000 | 3080828 | 9770.5249 |
| Puerto Rico | Americas | 1982 | 73.75000 | 3279001 | 10330.9891 |
| Puerto Rico | Americas | 1987 | 74.63000 | 3444468 | 12281.3419 |
| Puerto Rico | Americas | 1992 | 73.91100 | 3585176 | 14641.5871 |
| Puerto Rico | Americas | 1997 | 74.91700 | 3759430 | 16999.4333 |
| Puerto Rico | Americas | 2002 | 77.77800 | 3859606 | 18855.6062 |
| Puerto Rico | Americas | 2007 | 78.74600 | 3942491 | 19328.7090 |
| Reunion | Africa | 1952 | 52.72400 | 257700 | 2718.8853 |
| Reunion | Africa | 1957 | 55.09000 | 308700 | 2769.4518 |
| Reunion | Africa | 1962 | 57.66600 | 358900 | 3173.7233 |
| Reunion | Africa | 1967 | 60.54200 | 414024 | 4021.1757 |
| Reunion | Africa | 1972 | 64.27400 | 461633 | 5047.6586 |
| Reunion | Africa | 1977 | 67.06400 | 492095 | 4319.8041 |
| Reunion | Africa | 1982 | 69.88500 | 517810 | 5267.2194 |
| Reunion | Africa | 1987 | 71.91300 | 562035 | 5303.3775 |
| Reunion | Africa | 1992 | 73.61500 | 622191 | 6101.2558 |
| Reunion | Africa | 1997 | 74.77200 | 684810 | 6071.9414 |
| Reunion | Africa | 2002 | 75.74400 | 743981 | 6316.1652 |
| Reunion | Africa | 2007 | 76.44200 | 798094 | 7670.1226 |
| Romania | Europe | 1952 | 61.05000 | 16630000 | 3144.6132 |
| Romania | Europe | 1957 | 64.10000 | 17829327 | 3943.3702 |
| Romania | Europe | 1962 | 66.80000 | 18680721 | 4734.9976 |
| Romania | Europe | 1967 | 66.80000 | 19284814 | 6470.8665 |
| Romania | Europe | 1972 | 69.21000 | 20662648 | 8011.4144 |
| Romania | Europe | 1977 | 69.46000 | 21658597 | 9356.3972 |
| Romania | Europe | 1982 | 69.66000 | 22356726 | 9605.3141 |
| Romania | Europe | 1987 | 69.53000 | 22686371 | 9696.2733 |
| Romania | Europe | 1992 | 69.36000 | 22797027 | 6598.4099 |
| Romania | Europe | 1997 | 69.72000 | 22562458 | 7346.5476 |
| Romania | Europe | 2002 | 71.32200 | 22404337 | 7885.3601 |
| Romania | Europe | 2007 | 72.47600 | 22276056 | 10808.4756 |
| Rwanda | Africa | 1952 | 40.00000 | 2534927 | 493.3239 |
| Rwanda | Africa | 1957 | 41.50000 | 2822082 | 540.2894 |
| Rwanda | Africa | 1962 | 43.00000 | 3051242 | 597.4731 |
| Rwanda | Africa | 1967 | 44.10000 | 3451079 | 510.9637 |
| Rwanda | Africa | 1972 | 44.60000 | 3992121 | 590.5807 |
| Rwanda | Africa | 1977 | 45.00000 | 4657072 | 670.0806 |
| Rwanda | Africa | 1982 | 46.21800 | 5507565 | 881.5706 |
| Rwanda | Africa | 1987 | 44.02000 | 6349365 | 847.9912 |
| Rwanda | Africa | 1992 | 23.59900 | 7290203 | 737.0686 |
| Rwanda | Africa | 1997 | 36.08700 | 7212583 | 589.9445 |
| Rwanda | Africa | 2002 | 43.41300 | 7852401 | 785.6538 |
| Rwanda | Africa | 2007 | 46.24200 | 8860588 | 863.0885 |
| Sao Tome and Principe | Africa | 1952 | 46.47100 | 60011 | 879.5836 |
| Sao Tome and Principe | Africa | 1957 | 48.94500 | 61325 | 860.7369 |
| Sao Tome and Principe | Africa | 1962 | 51.89300 | 65345 | 1071.5511 |
| Sao Tome and Principe | Africa | 1967 | 54.42500 | 70787 | 1384.8406 |
| Sao Tome and Principe | Africa | 1972 | 56.48000 | 76595 | 1532.9853 |
| Sao Tome and Principe | Africa | 1977 | 58.55000 | 86796 | 1737.5617 |
| Sao Tome and Principe | Africa | 1982 | 60.35100 | 98593 | 1890.2181 |
| Sao Tome and Principe | Africa | 1987 | 61.72800 | 110812 | 1516.5255 |
| Sao Tome and Principe | Africa | 1992 | 62.74200 | 125911 | 1428.7778 |
| Sao Tome and Principe | Africa | 1997 | 63.30600 | 145608 | 1339.0760 |
| Sao Tome and Principe | Africa | 2002 | 64.33700 | 170372 | 1353.0924 |
| Sao Tome and Principe | Africa | 2007 | 65.52800 | 199579 | 1598.4351 |
| Saudi Arabia | Asia | 1952 | 39.87500 | 4005677 | 6459.5548 |
| Saudi Arabia | Asia | 1957 | 42.86800 | 4419650 | 8157.5912 |
| Saudi Arabia | Asia | 1962 | 45.91400 | 4943029 | 11626.4197 |
| Saudi Arabia | Asia | 1967 | 49.90100 | 5618198 | 16903.0489 |
| Saudi Arabia | Asia | 1972 | 53.88600 | 6472756 | 24837.4287 |
| Saudi Arabia | Asia | 1977 | 58.69000 | 8128505 | 34167.7626 |
| Saudi Arabia | Asia | 1982 | 63.01200 | 11254672 | 33693.1753 |
| Saudi Arabia | Asia | 1987 | 66.29500 | 14619745 | 21198.2614 |
| Saudi Arabia | Asia | 1992 | 68.76800 | 16945857 | 24841.6178 |
| Saudi Arabia | Asia | 1997 | 70.53300 | 21229759 | 20586.6902 |
| Saudi Arabia | Asia | 2002 | 71.62600 | 24501530 | 19014.5412 |
| Saudi Arabia | Asia | 2007 | 72.77700 | 27601038 | 21654.8319 |
| Senegal | Africa | 1952 | 37.27800 | 2755589 | 1450.3570 |
| Senegal | Africa | 1957 | 39.32900 | 3054547 | 1567.6530 |
| Senegal | Africa | 1962 | 41.45400 | 3430243 | 1654.9887 |
| Senegal | Africa | 1967 | 43.56300 | 3965841 | 1612.4046 |
| Senegal | Africa | 1972 | 45.81500 | 4588696 | 1597.7121 |
| Senegal | Africa | 1977 | 48.87900 | 5260855 | 1561.7691 |
| Senegal | Africa | 1982 | 52.37900 | 6147783 | 1518.4800 |
| Senegal | Africa | 1987 | 55.76900 | 7171347 | 1441.7207 |
| Senegal | Africa | 1992 | 58.19600 | 8307920 | 1367.8994 |
| Senegal | Africa | 1997 | 60.18700 | 9535314 | 1392.3683 |
| Senegal | Africa | 2002 | 61.60000 | 10870037 | 1519.6353 |
| Senegal | Africa | 2007 | 63.06200 | 12267493 | 1712.4721 |
| Serbia | Europe | 1952 | 57.99600 | 6860147 | 3581.4594 |
| Serbia | Europe | 1957 | 61.68500 | 7271135 | 4981.0909 |
| Serbia | Europe | 1962 | 64.53100 | 7616060 | 6289.6292 |
| Serbia | Europe | 1967 | 66.91400 | 7971222 | 7991.7071 |
| Serbia | Europe | 1972 | 68.70000 | 8313288 | 10522.0675 |
| Serbia | Europe | 1977 | 70.30000 | 8686367 | 12980.6696 |
| Serbia | Europe | 1982 | 70.16200 | 9032824 | 15181.0927 |
| Serbia | Europe | 1987 | 71.21800 | 9230783 | 15870.8785 |
| Serbia | Europe | 1992 | 71.65900 | 9826397 | 9325.0682 |
| Serbia | Europe | 1997 | 72.23200 | 10336594 | 7914.3203 |
| Serbia | Europe | 2002 | 73.21300 | 10111559 | 7236.0753 |
| Serbia | Europe | 2007 | 74.00200 | 10150265 | 9786.5347 |
| Sierra Leone | Africa | 1952 | 30.33100 | 2143249 | 879.7877 |
| Sierra Leone | Africa | 1957 | 31.57000 | 2295678 | 1004.4844 |
| Sierra Leone | Africa | 1962 | 32.76700 | 2467895 | 1116.6399 |
| Sierra Leone | Africa | 1967 | 34.11300 | 2662190 | 1206.0435 |
| Sierra Leone | Africa | 1972 | 35.40000 | 2879013 | 1353.7598 |
| Sierra Leone | Africa | 1977 | 36.78800 | 3140897 | 1348.2852 |
| Sierra Leone | Africa | 1982 | 38.44500 | 3464522 | 1465.0108 |
| Sierra Leone | Africa | 1987 | 40.00600 | 3868905 | 1294.4478 |
| Sierra Leone | Africa | 1992 | 38.33300 | 4260884 | 1068.6963 |
| Sierra Leone | Africa | 1997 | 39.89700 | 4578212 | 574.6482 |
| Sierra Leone | Africa | 2002 | 41.01200 | 5359092 | 699.4897 |
| Sierra Leone | Africa | 2007 | 42.56800 | 6144562 | 862.5408 |
| Singapore | Asia | 1952 | 60.39600 | 1127000 | 2315.1382 |
| Singapore | Asia | 1957 | 63.17900 | 1445929 | 2843.1044 |
| Singapore | Asia | 1962 | 65.79800 | 1750200 | 3674.7356 |
| Singapore | Asia | 1967 | 67.94600 | 1977600 | 4977.4185 |
| Singapore | Asia | 1972 | 69.52100 | 2152400 | 8597.7562 |
| Singapore | Asia | 1977 | 70.79500 | 2325300 | 11210.0895 |
| Singapore | Asia | 1982 | 71.76000 | 2651869 | 15169.1611 |
| Singapore | Asia | 1987 | 73.56000 | 2794552 | 18861.5308 |
| Singapore | Asia | 1992 | 75.78800 | 3235865 | 24769.8912 |
| Singapore | Asia | 1997 | 77.15800 | 3802309 | 33519.4766 |
| Singapore | Asia | 2002 | 78.77000 | 4197776 | 36023.1054 |
| Singapore | Asia | 2007 | 79.97200 | 4553009 | 47143.1796 |
| Slovak Republic | Europe | 1952 | 64.36000 | 3558137 | 5074.6591 |
| Slovak Republic | Europe | 1957 | 67.45000 | 3844277 | 6093.2630 |
| Slovak Republic | Europe | 1962 | 70.33000 | 4237384 | 7481.1076 |
| Slovak Republic | Europe | 1967 | 70.98000 | 4442238 | 8412.9024 |
| Slovak Republic | Europe | 1972 | 70.35000 | 4593433 | 9674.1676 |
| Slovak Republic | Europe | 1977 | 70.45000 | 4827803 | 10922.6640 |
| Slovak Republic | Europe | 1982 | 70.80000 | 5048043 | 11348.5459 |
| Slovak Republic | Europe | 1987 | 71.08000 | 5199318 | 12037.2676 |
| Slovak Republic | Europe | 1992 | 71.38000 | 5302888 | 9498.4677 |
| Slovak Republic | Europe | 1997 | 72.71000 | 5383010 | 12126.2306 |
| Slovak Republic | Europe | 2002 | 73.80000 | 5410052 | 13638.7784 |
| Slovak Republic | Europe | 2007 | 74.66300 | 5447502 | 18678.3144 |
| Slovenia | Europe | 1952 | 65.57000 | 1489518 | 4215.0417 |
| Slovenia | Europe | 1957 | 67.85000 | 1533070 | 5862.2766 |
| Slovenia | Europe | 1962 | 69.15000 | 1582962 | 7402.3034 |
| Slovenia | Europe | 1967 | 69.18000 | 1646912 | 9405.4894 |
| Slovenia | Europe | 1972 | 69.82000 | 1694510 | 12383.4862 |
| Slovenia | Europe | 1977 | 70.97000 | 1746919 | 15277.0302 |
| Slovenia | Europe | 1982 | 71.06300 | 1861252 | 17866.7218 |
| Slovenia | Europe | 1987 | 72.25000 | 1945870 | 18678.5349 |
| Slovenia | Europe | 1992 | 73.64000 | 1999210 | 14214.7168 |
| Slovenia | Europe | 1997 | 75.13000 | 2011612 | 17161.1073 |
| Slovenia | Europe | 2002 | 76.66000 | 2011497 | 20660.0194 |
| Slovenia | Europe | 2007 | 77.92600 | 2009245 | 25768.2576 |
| Somalia | Africa | 1952 | 32.97800 | 2526994 | 1135.7498 |
| Somalia | Africa | 1957 | 34.97700 | 2780415 | 1258.1474 |
| Somalia | Africa | 1962 | 36.98100 | 3080153 | 1369.4883 |
| Somalia | Africa | 1967 | 38.97700 | 3428839 | 1284.7332 |
| Somalia | Africa | 1972 | 40.97300 | 3840161 | 1254.5761 |
| Somalia | Africa | 1977 | 41.97400 | 4353666 | 1450.9925 |
| Somalia | Africa | 1982 | 42.95500 | 5828892 | 1176.8070 |
| Somalia | Africa | 1987 | 44.50100 | 6921858 | 1093.2450 |
| Somalia | Africa | 1992 | 39.65800 | 6099799 | 926.9603 |
| Somalia | Africa | 1997 | 43.79500 | 6633514 | 930.5964 |
| Somalia | Africa | 2002 | 45.93600 | 7753310 | 882.0818 |
| Somalia | Africa | 2007 | 48.15900 | 9118773 | 926.1411 |
| South Africa | Africa | 1952 | 45.00900 | 14264935 | 4725.2955 |
| South Africa | Africa | 1957 | 47.98500 | 16151549 | 5487.1042 |
| South Africa | Africa | 1962 | 49.95100 | 18356657 | 5768.7297 |
| South Africa | Africa | 1967 | 51.92700 | 20997321 | 7114.4780 |
| South Africa | Africa | 1972 | 53.69600 | 23935810 | 7765.9626 |
| South Africa | Africa | 1977 | 55.52700 | 27129932 | 8028.6514 |
| South Africa | Africa | 1982 | 58.16100 | 31140029 | 8568.2662 |
| South Africa | Africa | 1987 | 60.83400 | 35933379 | 7825.8234 |
| South Africa | Africa | 1992 | 61.88800 | 39964159 | 7225.0693 |
| South Africa | Africa | 1997 | 60.23600 | 42835005 | 7479.1882 |
| South Africa | Africa | 2002 | 53.36500 | 44433622 | 7710.9464 |
| South Africa | Africa | 2007 | 49.33900 | 43997828 | 9269.6578 |
| Spain | Europe | 1952 | 64.94000 | 28549870 | 3834.0347 |
| Spain | Europe | 1957 | 66.66000 | 29841614 | 4564.8024 |
| Spain | Europe | 1962 | 69.69000 | 31158061 | 5693.8439 |
| Spain | Europe | 1967 | 71.44000 | 32850275 | 7993.5123 |
| Spain | Europe | 1972 | 73.06000 | 34513161 | 10638.7513 |
| Spain | Europe | 1977 | 74.39000 | 36439000 | 13236.9212 |
| Spain | Europe | 1982 | 76.30000 | 37983310 | 13926.1700 |
| Spain | Europe | 1987 | 76.90000 | 38880702 | 15764.9831 |
| Spain | Europe | 1992 | 77.57000 | 39549438 | 18603.0645 |
| Spain | Europe | 1997 | 78.77000 | 39855442 | 20445.2990 |
| Spain | Europe | 2002 | 79.78000 | 40152517 | 24835.4717 |
| Spain | Europe | 2007 | 80.94100 | 40448191 | 28821.0637 |
| Sri Lanka | Asia | 1952 | 57.59300 | 7982342 | 1083.5320 |
| Sri Lanka | Asia | 1957 | 61.45600 | 9128546 | 1072.5466 |
| Sri Lanka | Asia | 1962 | 62.19200 | 10421936 | 1074.4720 |
| Sri Lanka | Asia | 1967 | 64.26600 | 11737396 | 1135.5143 |
| Sri Lanka | Asia | 1972 | 65.04200 | 13016733 | 1213.3955 |
| Sri Lanka | Asia | 1977 | 65.94900 | 14116836 | 1348.7757 |
| Sri Lanka | Asia | 1982 | 68.75700 | 15410151 | 1648.0798 |
| Sri Lanka | Asia | 1987 | 69.01100 | 16495304 | 1876.7668 |
| Sri Lanka | Asia | 1992 | 70.37900 | 17587060 | 2153.7392 |
| Sri Lanka | Asia | 1997 | 70.45700 | 18698655 | 2664.4773 |
| Sri Lanka | Asia | 2002 | 70.81500 | 19576783 | 3015.3788 |
| Sri Lanka | Asia | 2007 | 72.39600 | 20378239 | 3970.0954 |
| Sudan | Africa | 1952 | 38.63500 | 8504667 | 1615.9911 |
| Sudan | Africa | 1957 | 39.62400 | 9753392 | 1770.3371 |
| Sudan | Africa | 1962 | 40.87000 | 11183227 | 1959.5938 |
| Sudan | Africa | 1967 | 42.85800 | 12716129 | 1687.9976 |
| Sudan | Africa | 1972 | 45.08300 | 14597019 | 1659.6528 |
| Sudan | Africa | 1977 | 47.80000 | 17104986 | 2202.9884 |
| Sudan | Africa | 1982 | 50.33800 | 20367053 | 1895.5441 |
| Sudan | Africa | 1987 | 51.74400 | 24725960 | 1507.8192 |
| Sudan | Africa | 1992 | 53.55600 | 28227588 | 1492.1970 |
| Sudan | Africa | 1997 | 55.37300 | 32160729 | 1632.2108 |
| Sudan | Africa | 2002 | 56.36900 | 37090298 | 1993.3983 |
| Sudan | Africa | 2007 | 58.55600 | 42292929 | 2602.3950 |
| Swaziland | Africa | 1952 | 41.40700 | 290243 | 1148.3766 |
| Swaziland | Africa | 1957 | 43.42400 | 326741 | 1244.7084 |
| Swaziland | Africa | 1962 | 44.99200 | 370006 | 1856.1821 |
| Swaziland | Africa | 1967 | 46.63300 | 420690 | 2613.1017 |
| Swaziland | Africa | 1972 | 49.55200 | 480105 | 3364.8366 |
| Swaziland | Africa | 1977 | 52.53700 | 551425 | 3781.4106 |
| Swaziland | Africa | 1982 | 55.56100 | 649901 | 3895.3840 |
| Swaziland | Africa | 1987 | 57.67800 | 779348 | 3984.8398 |
| Swaziland | Africa | 1992 | 58.47400 | 962344 | 3553.0224 |
| Swaziland | Africa | 1997 | 54.28900 | 1054486 | 3876.7685 |
| Swaziland | Africa | 2002 | 43.86900 | 1130269 | 4128.1169 |
| Swaziland | Africa | 2007 | 39.61300 | 1133066 | 4513.4806 |
| Sweden | Europe | 1952 | 71.86000 | 7124673 | 8527.8447 |
| Sweden | Europe | 1957 | 72.49000 | 7363802 | 9911.8782 |
| Sweden | Europe | 1962 | 73.37000 | 7561588 | 12329.4419 |
| Sweden | Europe | 1967 | 74.16000 | 7867931 | 15258.2970 |
| Sweden | Europe | 1972 | 74.72000 | 8122293 | 17832.0246 |
| Sweden | Europe | 1977 | 75.44000 | 8251648 | 18855.7252 |
| Sweden | Europe | 1982 | 76.42000 | 8325260 | 20667.3812 |
| Sweden | Europe | 1987 | 77.19000 | 8421403 | 23586.9293 |
| Sweden | Europe | 1992 | 78.16000 | 8718867 | 23880.0168 |
| Sweden | Europe | 1997 | 79.39000 | 8897619 | 25266.5950 |
| Sweden | Europe | 2002 | 80.04000 | 8954175 | 29341.6309 |
| Sweden | Europe | 2007 | 80.88400 | 9031088 | 33859.7484 |
| Switzerland | Europe | 1952 | 69.62000 | 4815000 | 14734.2327 |
| Switzerland | Europe | 1957 | 70.56000 | 5126000 | 17909.4897 |
| Switzerland | Europe | 1962 | 71.32000 | 5666000 | 20431.0927 |
| Switzerland | Europe | 1967 | 72.77000 | 6063000 | 22966.1443 |
| Switzerland | Europe | 1972 | 73.78000 | 6401400 | 27195.1130 |
| Switzerland | Europe | 1977 | 75.39000 | 6316424 | 26982.2905 |
| Switzerland | Europe | 1982 | 76.21000 | 6468126 | 28397.7151 |
| Switzerland | Europe | 1987 | 77.41000 | 6649942 | 30281.7046 |
| Switzerland | Europe | 1992 | 78.03000 | 6995447 | 31871.5303 |
| Switzerland | Europe | 1997 | 79.37000 | 7193761 | 32135.3230 |
| Switzerland | Europe | 2002 | 80.62000 | 7361757 | 34480.9577 |
| Switzerland | Europe | 2007 | 81.70100 | 7554661 | 37506.4191 |
| Syria | Asia | 1952 | 45.88300 | 3661549 | 1643.4854 |
| Syria | Asia | 1957 | 48.28400 | 4149908 | 2117.2349 |
| Syria | Asia | 1962 | 50.30500 | 4834621 | 2193.0371 |
| Syria | Asia | 1967 | 53.65500 | 5680812 | 1881.9236 |
| Syria | Asia | 1972 | 57.29600 | 6701172 | 2571.4230 |
| Syria | Asia | 1977 | 61.19500 | 7932503 | 3195.4846 |
| Syria | Asia | 1982 | 64.59000 | 9410494 | 3761.8377 |
| Syria | Asia | 1987 | 66.97400 | 11242847 | 3116.7743 |
| Syria | Asia | 1992 | 69.24900 | 13219062 | 3340.5428 |
| Syria | Asia | 1997 | 71.52700 | 15081016 | 4014.2390 |
| Syria | Asia | 2002 | 73.05300 | 17155814 | 4090.9253 |
| Syria | Asia | 2007 | 74.14300 | 19314747 | 4184.5481 |
| Taiwan | Asia | 1952 | 58.50000 | 8550362 | 1206.9479 |
| Taiwan | Asia | 1957 | 62.40000 | 10164215 | 1507.8613 |
| Taiwan | Asia | 1962 | 65.20000 | 11918938 | 1822.8790 |
| Taiwan | Asia | 1967 | 67.50000 | 13648692 | 2643.8587 |
| Taiwan | Asia | 1972 | 69.39000 | 15226039 | 4062.5239 |
| Taiwan | Asia | 1977 | 70.59000 | 16785196 | 5596.5198 |
| Taiwan | Asia | 1982 | 72.16000 | 18501390 | 7426.3548 |
| Taiwan | Asia | 1987 | 73.40000 | 19757799 | 11054.5618 |
| Taiwan | Asia | 1992 | 74.26000 | 20686918 | 15215.6579 |
| Taiwan | Asia | 1997 | 75.25000 | 21628605 | 20206.8210 |
| Taiwan | Asia | 2002 | 76.99000 | 22454239 | 23235.4233 |
| Taiwan | Asia | 2007 | 78.40000 | 23174294 | 28718.2768 |
| Tanzania | Africa | 1952 | 41.21500 | 8322925 | 716.6501 |
| Tanzania | Africa | 1957 | 42.97400 | 9452826 | 698.5356 |
| Tanzania | Africa | 1962 | 44.24600 | 10863958 | 722.0038 |
| Tanzania | Africa | 1967 | 45.75700 | 12607312 | 848.2187 |
| Tanzania | Africa | 1972 | 47.62000 | 14706593 | 915.9851 |
| Tanzania | Africa | 1977 | 49.91900 | 17129565 | 962.4923 |
| Tanzania | Africa | 1982 | 50.60800 | 19844382 | 874.2426 |
| Tanzania | Africa | 1987 | 51.53500 | 23040630 | 831.8221 |
| Tanzania | Africa | 1992 | 50.44000 | 26605473 | 825.6825 |
| Tanzania | Africa | 1997 | 48.46600 | 30686889 | 789.1862 |
| Tanzania | Africa | 2002 | 49.65100 | 34593779 | 899.0742 |
| Tanzania | Africa | 2007 | 52.51700 | 38139640 | 1107.4822 |
| Thailand | Asia | 1952 | 50.84800 | 21289402 | 757.7974 |
| Thailand | Asia | 1957 | 53.63000 | 25041917 | 793.5774 |
| Thailand | Asia | 1962 | 56.06100 | 29263397 | 1002.1992 |
| Thailand | Asia | 1967 | 58.28500 | 34024249 | 1295.4607 |
| Thailand | Asia | 1972 | 60.40500 | 39276153 | 1524.3589 |
| Thailand | Asia | 1977 | 62.49400 | 44148285 | 1961.2246 |
| Thailand | Asia | 1982 | 64.59700 | 48827160 | 2393.2198 |
| Thailand | Asia | 1987 | 66.08400 | 52910342 | 2982.6538 |
| Thailand | Asia | 1992 | 67.29800 | 56667095 | 4616.8965 |
| Thailand | Asia | 1997 | 67.52100 | 60216677 | 5852.6255 |
| Thailand | Asia | 2002 | 68.56400 | 62806748 | 5913.1875 |
| Thailand | Asia | 2007 | 70.61600 | 65068149 | 7458.3963 |
| Togo | Africa | 1952 | 38.59600 | 1219113 | 859.8087 |
| Togo | Africa | 1957 | 41.20800 | 1357445 | 925.9083 |
| Togo | Africa | 1962 | 43.92200 | 1528098 | 1067.5348 |
| Togo | Africa | 1967 | 46.76900 | 1735550 | 1477.5968 |
| Togo | Africa | 1972 | 49.75900 | 2056351 | 1649.6602 |
| Togo | Africa | 1977 | 52.88700 | 2308582 | 1532.7770 |
| Togo | Africa | 1982 | 55.47100 | 2644765 | 1344.5780 |
| Togo | Africa | 1987 | 56.94100 | 3154264 | 1202.2014 |
| Togo | Africa | 1992 | 58.06100 | 3747553 | 1034.2989 |
| Togo | Africa | 1997 | 58.39000 | 4320890 | 982.2869 |
| Togo | Africa | 2002 | 57.56100 | 4977378 | 886.2206 |
| Togo | Africa | 2007 | 58.42000 | 5701579 | 882.9699 |
| Trinidad and Tobago | Americas | 1952 | 59.10000 | 662850 | 3023.2719 |
| Trinidad and Tobago | Americas | 1957 | 61.80000 | 764900 | 4100.3934 |
| Trinidad and Tobago | Americas | 1962 | 64.90000 | 887498 | 4997.5240 |
| Trinidad and Tobago | Americas | 1967 | 65.40000 | 960155 | 5621.3685 |
| Trinidad and Tobago | Americas | 1972 | 65.90000 | 975199 | 6619.5514 |
| Trinidad and Tobago | Americas | 1977 | 68.30000 | 1039009 | 7899.5542 |
| Trinidad and Tobago | Americas | 1982 | 68.83200 | 1116479 | 9119.5286 |
| Trinidad and Tobago | Americas | 1987 | 69.58200 | 1191336 | 7388.5978 |
| Trinidad and Tobago | Americas | 1992 | 69.86200 | 1183669 | 7370.9909 |
| Trinidad and Tobago | Americas | 1997 | 69.46500 | 1138101 | 8792.5731 |
| Trinidad and Tobago | Americas | 2002 | 68.97600 | 1101832 | 11460.6002 |
| Trinidad and Tobago | Americas | 2007 | 69.81900 | 1056608 | 18008.5092 |
| Tunisia | Africa | 1952 | 44.60000 | 3647735 | 1468.4756 |
| Tunisia | Africa | 1957 | 47.10000 | 3950849 | 1395.2325 |
| Tunisia | Africa | 1962 | 49.57900 | 4286552 | 1660.3032 |
| Tunisia | Africa | 1967 | 52.05300 | 4786986 | 1932.3602 |
| Tunisia | Africa | 1972 | 55.60200 | 5303507 | 2753.2860 |
| Tunisia | Africa | 1977 | 59.83700 | 6005061 | 3120.8768 |
| Tunisia | Africa | 1982 | 64.04800 | 6734098 | 3560.2332 |
| Tunisia | Africa | 1987 | 66.89400 | 7724976 | 3810.4193 |
| Tunisia | Africa | 1992 | 70.00100 | 8523077 | 4332.7202 |
| Tunisia | Africa | 1997 | 71.97300 | 9231669 | 4876.7986 |
| Tunisia | Africa | 2002 | 73.04200 | 9770575 | 5722.8957 |
| Tunisia | Africa | 2007 | 73.92300 | 10276158 | 7092.9230 |
| Turkey | Europe | 1952 | 43.58500 | 22235677 | 1969.1010 |
| Turkey | Europe | 1957 | 48.07900 | 25670939 | 2218.7543 |
| Turkey | Europe | 1962 | 52.09800 | 29788695 | 2322.8699 |
| Turkey | Europe | 1967 | 54.33600 | 33411317 | 2826.3564 |
| Turkey | Europe | 1972 | 57.00500 | 37492953 | 3450.6964 |
| Turkey | Europe | 1977 | 59.50700 | 42404033 | 4269.1223 |
| Turkey | Europe | 1982 | 61.03600 | 47328791 | 4241.3563 |
| Turkey | Europe | 1987 | 63.10800 | 52881328 | 5089.0437 |
| Turkey | Europe | 1992 | 66.14600 | 58179144 | 5678.3483 |
| Turkey | Europe | 1997 | 68.83500 | 63047647 | 6601.4299 |
| Turkey | Europe | 2002 | 70.84500 | 67308928 | 6508.0857 |
| Turkey | Europe | 2007 | 71.77700 | 71158647 | 8458.2764 |
| Uganda | Africa | 1952 | 39.97800 | 5824797 | 734.7535 |
| Uganda | Africa | 1957 | 42.57100 | 6675501 | 774.3711 |
| Uganda | Africa | 1962 | 45.34400 | 7688797 | 767.2717 |
| Uganda | Africa | 1967 | 48.05100 | 8900294 | 908.9185 |
| Uganda | Africa | 1972 | 51.01600 | 10190285 | 950.7359 |
| Uganda | Africa | 1977 | 50.35000 | 11457758 | 843.7331 |
| Uganda | Africa | 1982 | 49.84900 | 12939400 | 682.2662 |
| Uganda | Africa | 1987 | 51.50900 | 15283050 | 617.7244 |
| Uganda | Africa | 1992 | 48.82500 | 18252190 | 644.1708 |
| Uganda | Africa | 1997 | 44.57800 | 21210254 | 816.5591 |
| Uganda | Africa | 2002 | 47.81300 | 24739869 | 927.7210 |
| Uganda | Africa | 2007 | 51.54200 | 29170398 | 1056.3801 |
| United Kingdom | Europe | 1952 | 69.18000 | 50430000 | 9979.5085 |
| United Kingdom | Europe | 1957 | 70.42000 | 51430000 | 11283.1779 |
| United Kingdom | Europe | 1962 | 70.76000 | 53292000 | 12477.1771 |
| United Kingdom | Europe | 1967 | 71.36000 | 54959000 | 14142.8509 |
| United Kingdom | Europe | 1972 | 72.01000 | 56079000 | 15895.1164 |
| United Kingdom | Europe | 1977 | 72.76000 | 56179000 | 17428.7485 |
| United Kingdom | Europe | 1982 | 74.04000 | 56339704 | 18232.4245 |
| United Kingdom | Europe | 1987 | 75.00700 | 56981620 | 21664.7877 |
| United Kingdom | Europe | 1992 | 76.42000 | 57866349 | 22705.0925 |
| United Kingdom | Europe | 1997 | 77.21800 | 58808266 | 26074.5314 |
| United Kingdom | Europe | 2002 | 78.47100 | 59912431 | 29478.9992 |
| United Kingdom | Europe | 2007 | 79.42500 | 60776238 | 33203.2613 |
| United States | Americas | 1952 | 68.44000 | 157553000 | 13990.4821 |
| United States | Americas | 1957 | 69.49000 | 171984000 | 14847.1271 |
| United States | Americas | 1962 | 70.21000 | 186538000 | 16173.1459 |
| United States | Americas | 1967 | 70.76000 | 198712000 | 19530.3656 |
| United States | Americas | 1972 | 71.34000 | 209896000 | 21806.0359 |
| United States | Americas | 1977 | 73.38000 | 220239000 | 24072.6321 |
| United States | Americas | 1982 | 74.65000 | 232187835 | 25009.5591 |
| United States | Americas | 1987 | 75.02000 | 242803533 | 29884.3504 |
| United States | Americas | 1992 | 76.09000 | 256894189 | 32003.9322 |
| United States | Americas | 1997 | 76.81000 | 272911760 | 35767.4330 |
| United States | Americas | 2002 | 77.31000 | 287675526 | 39097.0995 |
| United States | Americas | 2007 | 78.24200 | 301139947 | 42951.6531 |
| Uruguay | Americas | 1952 | 66.07100 | 2252965 | 5716.7667 |
| Uruguay | Americas | 1957 | 67.04400 | 2424959 | 6150.7730 |
| Uruguay | Americas | 1962 | 68.25300 | 2598466 | 5603.3577 |
| Uruguay | Americas | 1967 | 68.46800 | 2748579 | 5444.6196 |
| Uruguay | Americas | 1972 | 68.67300 | 2829526 | 5703.4089 |
| Uruguay | Americas | 1977 | 69.48100 | 2873520 | 6504.3397 |
| Uruguay | Americas | 1982 | 70.80500 | 2953997 | 6920.2231 |
| Uruguay | Americas | 1987 | 71.91800 | 3045153 | 7452.3990 |
| Uruguay | Americas | 1992 | 72.75200 | 3149262 | 8137.0048 |
| Uruguay | Americas | 1997 | 74.22300 | 3262838 | 9230.2407 |
| Uruguay | Americas | 2002 | 75.30700 | 3363085 | 7727.0020 |
| Uruguay | Americas | 2007 | 76.38400 | 3447496 | 10611.4630 |
| Venezuela | Americas | 1952 | 55.08800 | 5439568 | 7689.7998 |
| Venezuela | Americas | 1957 | 57.90700 | 6702668 | 9802.4665 |
| Venezuela | Americas | 1962 | 60.77000 | 8143375 | 8422.9742 |
| Venezuela | Americas | 1967 | 63.47900 | 9709552 | 9541.4742 |
| Venezuela | Americas | 1972 | 65.71200 | 11515649 | 10505.2597 |
| Venezuela | Americas | 1977 | 67.45600 | 13503563 | 13143.9510 |
| Venezuela | Americas | 1982 | 68.55700 | 15620766 | 11152.4101 |
| Venezuela | Americas | 1987 | 70.19000 | 17910182 | 9883.5846 |
| Venezuela | Americas | 1992 | 71.15000 | 20265563 | 10733.9263 |
| Venezuela | Americas | 1997 | 72.14600 | 22374398 | 10165.4952 |
| Venezuela | Americas | 2002 | 72.76600 | 24287670 | 8605.0478 |
| Venezuela | Americas | 2007 | 73.74700 | 26084662 | 11415.8057 |
| Vietnam | Asia | 1952 | 40.41200 | 26246839 | 605.0665 |
| Vietnam | Asia | 1957 | 42.88700 | 28998543 | 676.2854 |
| Vietnam | Asia | 1962 | 45.36300 | 33796140 | 772.0492 |
| Vietnam | Asia | 1967 | 47.83800 | 39463910 | 637.1233 |
| Vietnam | Asia | 1972 | 50.25400 | 44655014 | 699.5016 |
| Vietnam | Asia | 1977 | 55.76400 | 50533506 | 713.5371 |
| Vietnam | Asia | 1982 | 58.81600 | 56142181 | 707.2358 |
| Vietnam | Asia | 1987 | 62.82000 | 62826491 | 820.7994 |
| Vietnam | Asia | 1992 | 67.66200 | 69940728 | 989.0231 |
| Vietnam | Asia | 1997 | 70.67200 | 76048996 | 1385.8968 |
| Vietnam | Asia | 2002 | 73.01700 | 80908147 | 1764.4567 |
| Vietnam | Asia | 2007 | 74.24900 | 85262356 | 2441.5764 |
| West Bank and Gaza | Asia | 1952 | 43.16000 | 1030585 | 1515.5923 |
| West Bank and Gaza | Asia | 1957 | 45.67100 | 1070439 | 1827.0677 |
| West Bank and Gaza | Asia | 1962 | 48.12700 | 1133134 | 2198.9563 |
| West Bank and Gaza | Asia | 1967 | 51.63100 | 1142636 | 2649.7150 |
| West Bank and Gaza | Asia | 1972 | 56.53200 | 1089572 | 3133.4093 |
| West Bank and Gaza | Asia | 1977 | 60.76500 | 1261091 | 3682.8315 |
| West Bank and Gaza | Asia | 1982 | 64.40600 | 1425876 | 4336.0321 |
| West Bank and Gaza | Asia | 1987 | 67.04600 | 1691210 | 5107.1974 |
| West Bank and Gaza | Asia | 1992 | 69.71800 | 2104779 | 6017.6548 |
| West Bank and Gaza | Asia | 1997 | 71.09600 | 2826046 | 7110.6676 |
| West Bank and Gaza | Asia | 2002 | 72.37000 | 3389578 | 4515.4876 |
| West Bank and Gaza | Asia | 2007 | 73.42200 | 4018332 | 3025.3498 |
| Yemen, Rep. | Asia | 1952 | 32.54800 | 4963829 | 781.7176 |
| Yemen, Rep. | Asia | 1957 | 33.97000 | 5498090 | 804.8305 |
| Yemen, Rep. | Asia | 1962 | 35.18000 | 6120081 | 825.6232 |
| Yemen, Rep. | Asia | 1967 | 36.98400 | 6740785 | 862.4421 |
| Yemen, Rep. | Asia | 1972 | 39.84800 | 7407075 | 1265.0470 |
| Yemen, Rep. | Asia | 1977 | 44.17500 | 8403990 | 1829.7652 |
| Yemen, Rep. | Asia | 1982 | 49.11300 | 9657618 | 1977.5570 |
| Yemen, Rep. | Asia | 1987 | 52.92200 | 11219340 | 1971.7415 |
| Yemen, Rep. | Asia | 1992 | 55.59900 | 13367997 | 1879.4967 |
| Yemen, Rep. | Asia | 1997 | 58.02000 | 15826497 | 2117.4845 |
| Yemen, Rep. | Asia | 2002 | 60.30800 | 18701257 | 2234.8208 |
| Yemen, Rep. | Asia | 2007 | 62.69800 | 22211743 | 2280.7699 |
| Zambia | Africa | 1952 | 42.03800 | 2672000 | 1147.3888 |
| Zambia | Africa | 1957 | 44.07700 | 3016000 | 1311.9568 |
| Zambia | Africa | 1962 | 46.02300 | 3421000 | 1452.7258 |
| Zambia | Africa | 1967 | 47.76800 | 3900000 | 1777.0773 |
| Zambia | Africa | 1972 | 50.10700 | 4506497 | 1773.4983 |
| Zambia | Africa | 1977 | 51.38600 | 5216550 | 1588.6883 |
| Zambia | Africa | 1982 | 51.82100 | 6100407 | 1408.6786 |
| Zambia | Africa | 1987 | 50.82100 | 7272406 | 1213.3151 |
| Zambia | Africa | 1992 | 46.10000 | 8381163 | 1210.8846 |
| Zambia | Africa | 1997 | 40.23800 | 9417789 | 1071.3538 |
| Zambia | Africa | 2002 | 39.19300 | 10595811 | 1071.6139 |
| Zambia | Africa | 2007 | 42.38400 | 11746035 | 1271.2116 |
| Zimbabwe | Africa | 1952 | 48.45100 | 3080907 | 406.8841 |
| Zimbabwe | Africa | 1957 | 50.46900 | 3646340 | 518.7643 |
| Zimbabwe | Africa | 1962 | 52.35800 | 4277736 | 527.2722 |
| Zimbabwe | Africa | 1967 | 53.99500 | 4995432 | 569.7951 |
| Zimbabwe | Africa | 1972 | 55.63500 | 5861135 | 799.3622 |
| Zimbabwe | Africa | 1977 | 57.67400 | 6642107 | 685.5877 |
| Zimbabwe | Africa | 1982 | 60.36300 | 7636524 | 788.8550 |
| Zimbabwe | Africa | 1987 | 62.35100 | 9216418 | 706.1573 |
| Zimbabwe | Africa | 1992 | 60.37700 | 10704340 | 693.4208 |
| Zimbabwe | Africa | 1997 | 46.80900 | 11404948 | 792.4500 |
| Zimbabwe | Africa | 2002 | 39.98900 | 11926563 | 672.0386 |
| Zimbabwe | Africa | 2007 | 43.48700 | 12311143 | 469.7093 |
For simplicity, we’ll work with data for the 6 largest countries (by population) as of 2007.
Same data, different aesthetics
- Map country to color; Year to X-axis, Life Expectancy to Y-axis.
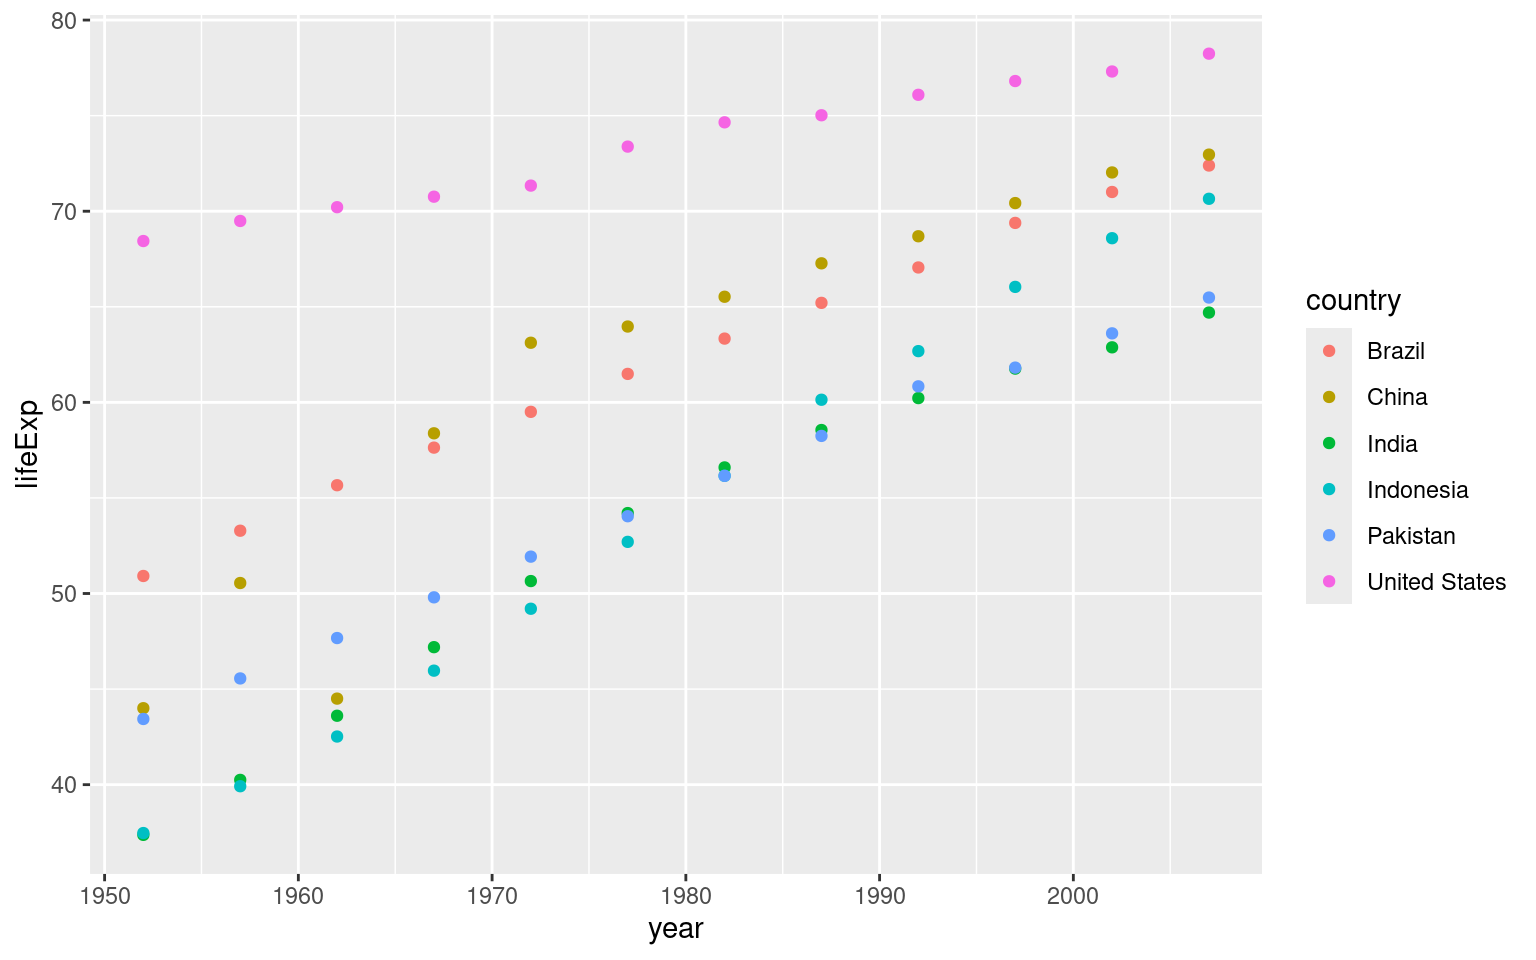
- Map year to color; per-capita GDP to X-axis, Life Expectancy to Y-axis.
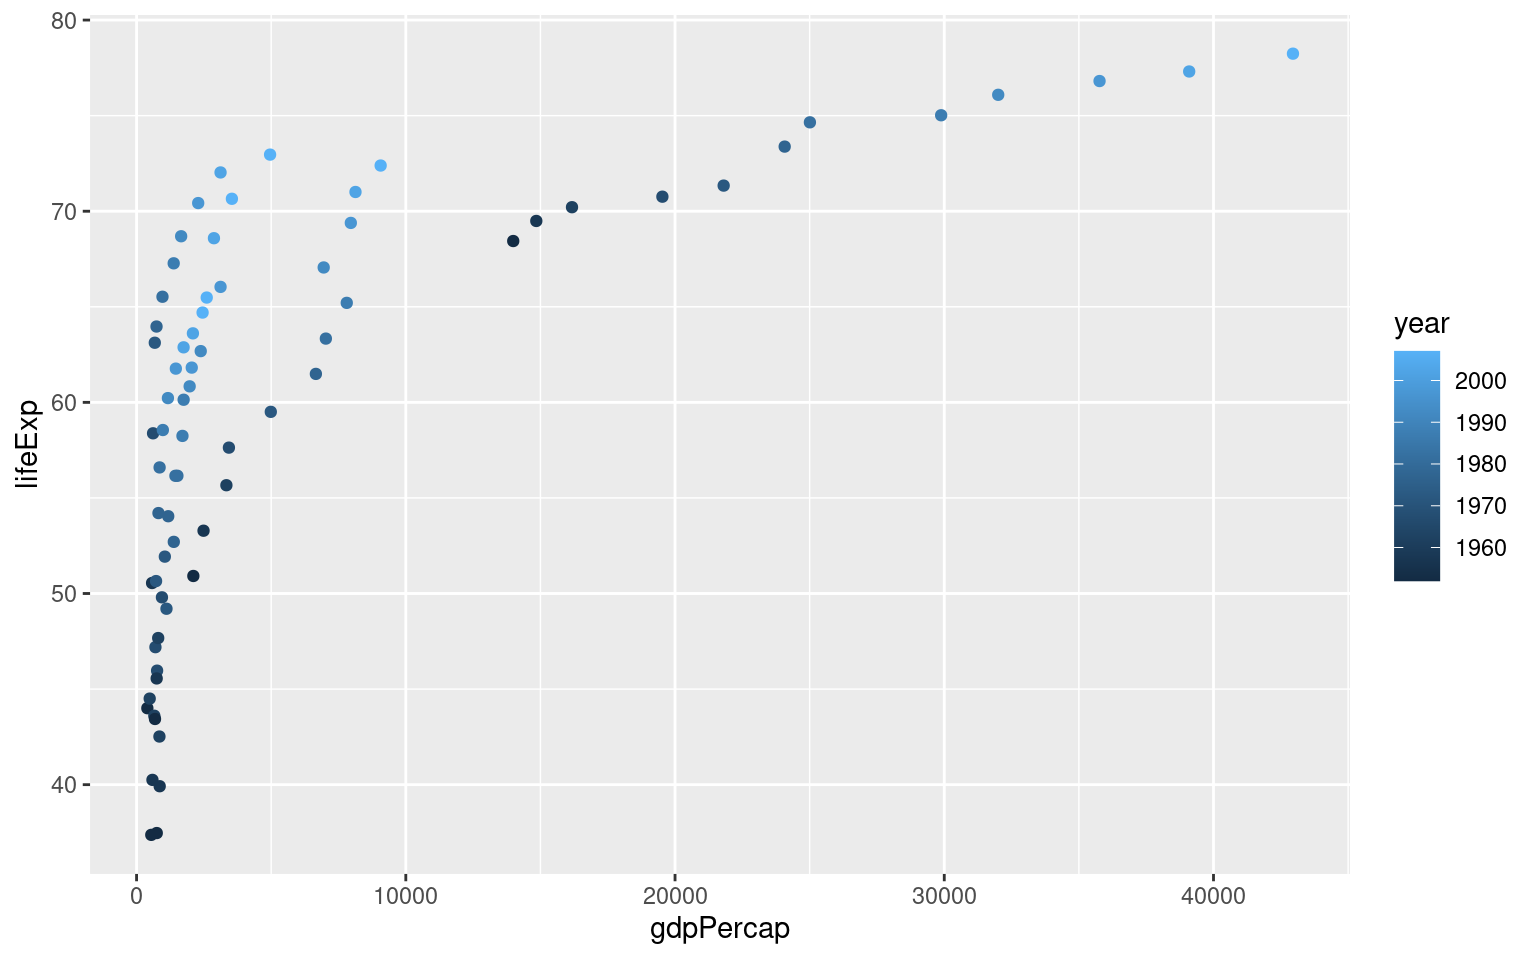
Same aesthetics, different geometries
- Map country to color; Year to X-axis, Life Expectancy to Y-axis. Show points for each entry.

- Map country to color; Year to X-axis, Life Expectancy to Y-axis. Show lines for each entry.
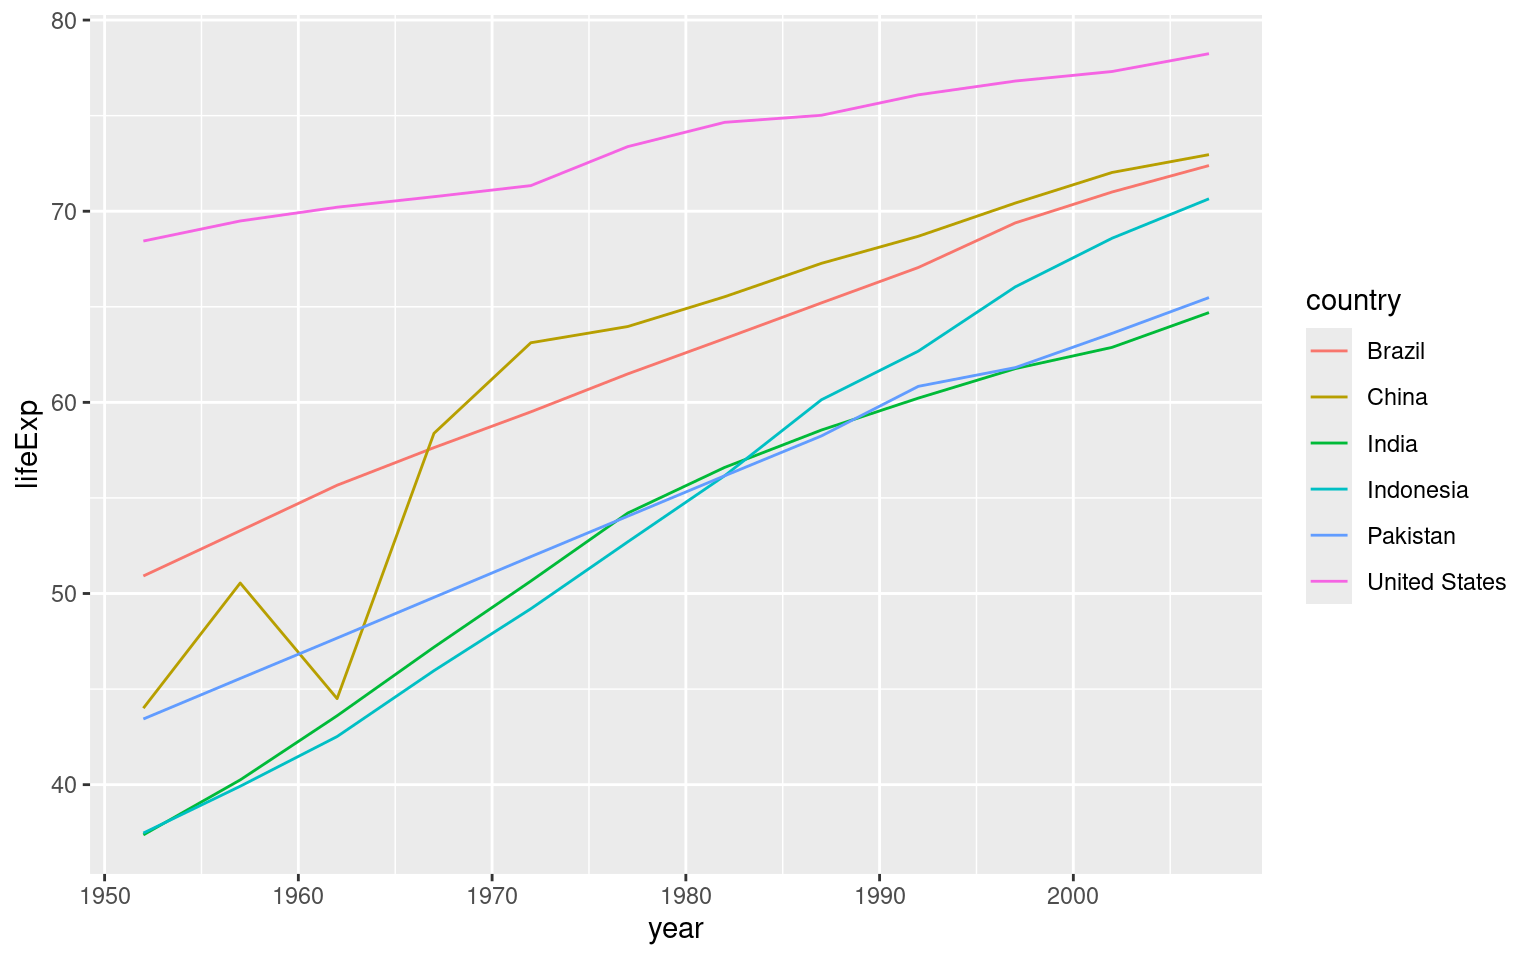
- Map country to color; Year to X-axis, Life Expectancy to Y-axis. Show points and lines for each entry.

Note that sometimes, graphs have the right syntax but are meaningless
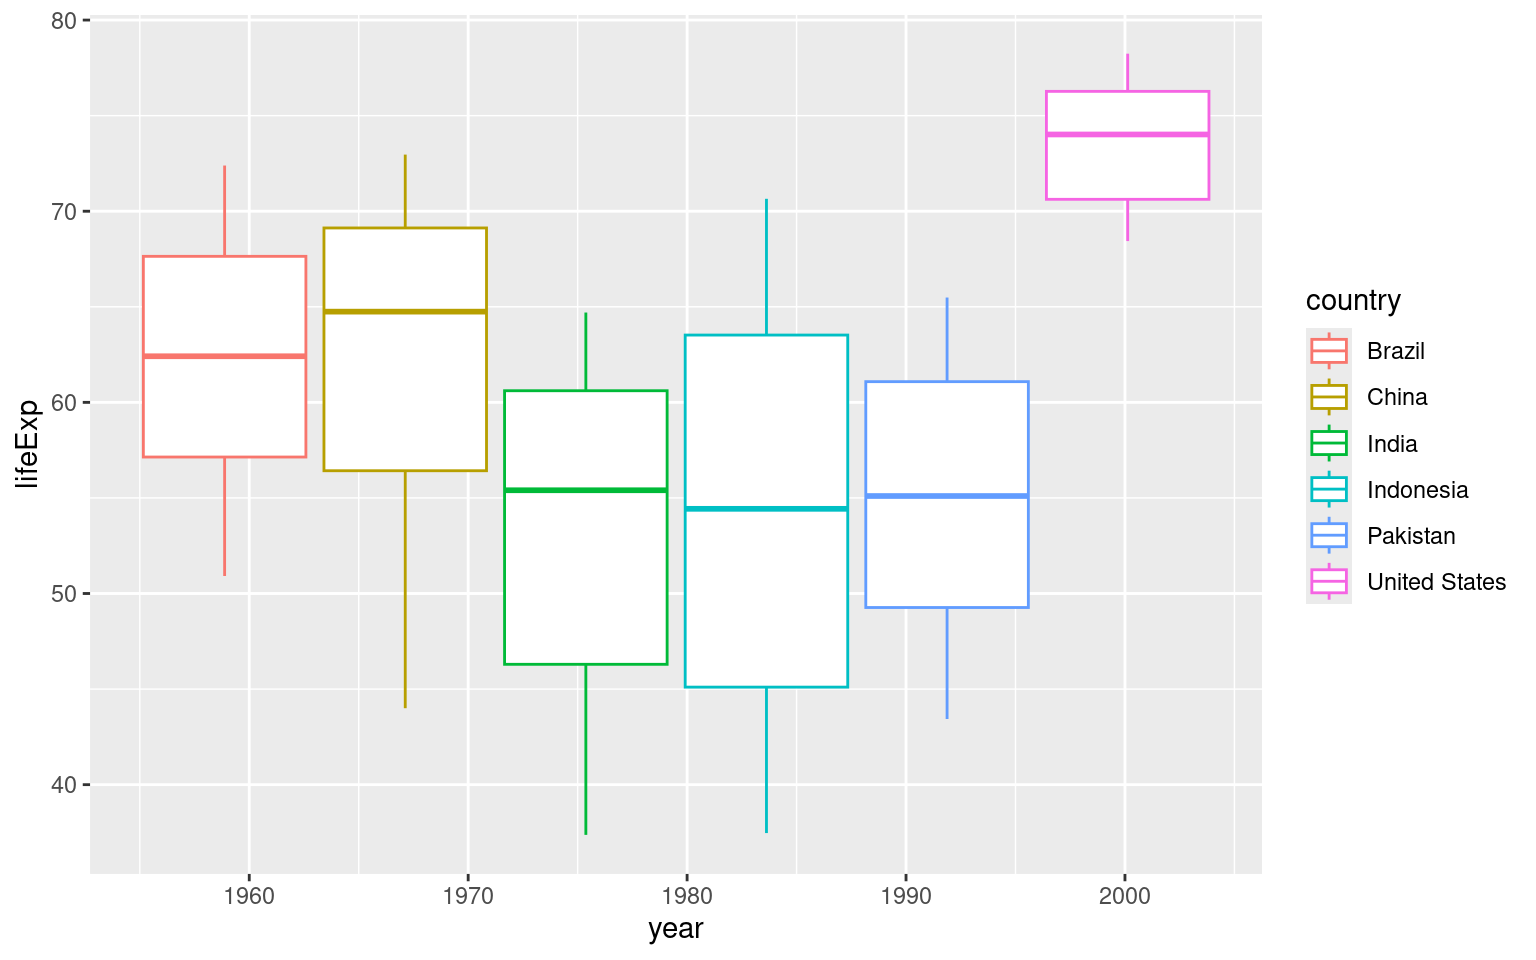
See also Noam Chomsky’s “Colorless green ideas sleep furiously”
Same aesthetics and geometries, different scales
- Map country to color; Year to X-axis, Life Expectancy to Y-axis. Show points and lines for each entry. Use default scales.
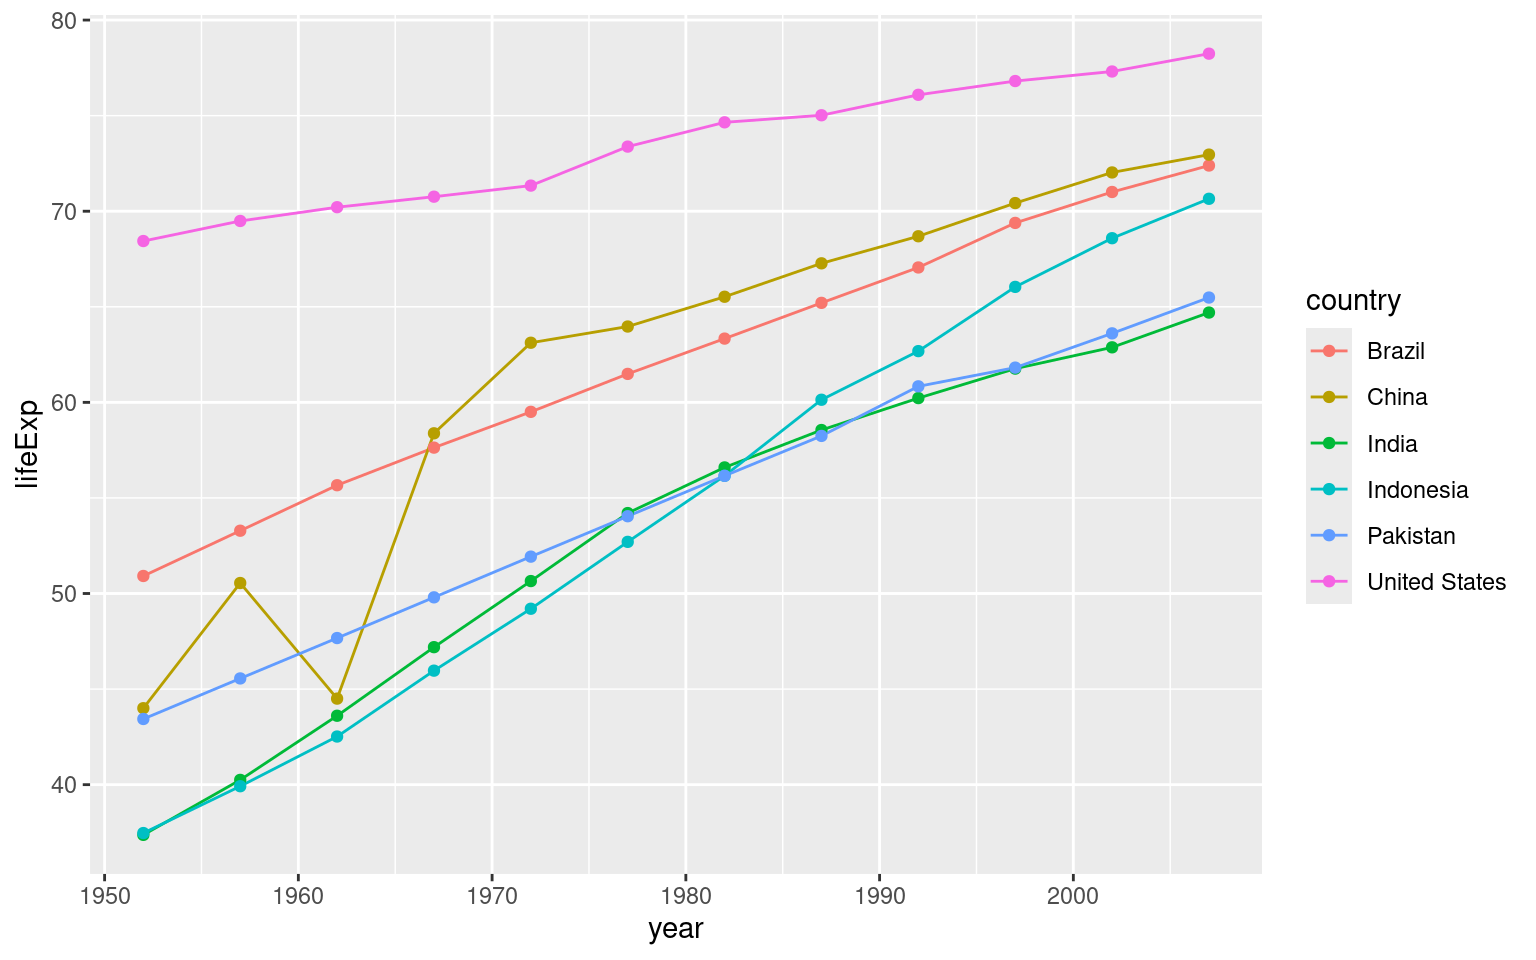
- Map country to color; Year to X-axis, Life Expectancy to Y-axis. Show points and lines for each entry. Scale the colors manually.

- Map country to color; Year to X-axis, Life Expectancy to Y-axis. Show points and lines for each entry. Scale the colors using a pre-defined palette.
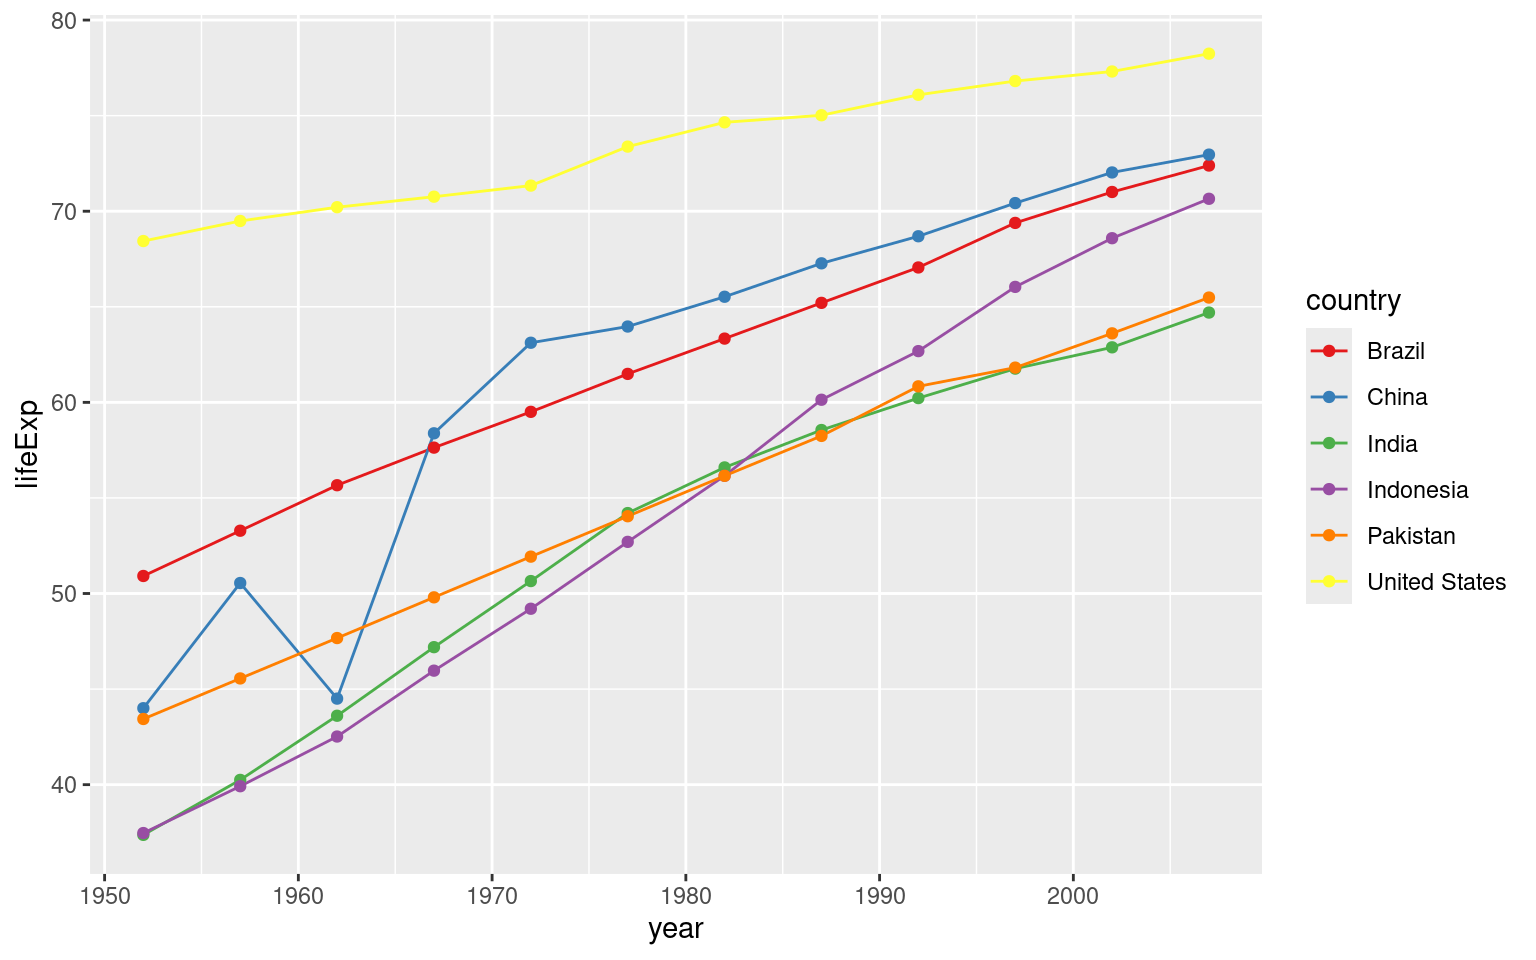
Your turn to practice
Practicing with the palmerpenguiuns dataset

Code
| species | island | bill_length_mm | bill_depth_mm | flipper_length_mm | body_mass_g | sex | year |
|---|---|---|---|---|---|---|---|
| Gentoo | Biscoe | 44.5 | 14.3 | 216 | 4100 | NA | 2007 |
| Chinstrap | Dream | 46.4 | 18.6 | 190 | 3450 | female | 2007 |
| Adelie | Biscoe | 38.2 | 20.0 | 190 | 3900 | male | 2009 |
| Adelie | Biscoe | 37.7 | 18.7 | 180 | 3600 | male | 2007 |
| Adelie | Dream | 39.7 | 17.9 | 193 | 4250 | male | 2009 |
| Chinstrap | Dream | 42.4 | 17.3 | 181 | 3600 | female | 2007 |
| Gentoo | Biscoe | 45.1 | 14.5 | 207 | 5050 | female | 2007 |
| Gentoo | Biscoe | 48.2 | 15.6 | 221 | 5100 | male | 2008 |
| Gentoo | Biscoe | 49.3 | 15.7 | 217 | 5850 | male | 2007 |
| Adelie | Biscoe | 45.6 | 20.3 | 191 | 4600 | male | 2009 |
Think for yourself:
- What kind of information is encoded in this sheet?
- What are some relationships I can explore?
- How can I map properties of the data onto aesthetics of the graph?
- How can I choose meaningful scales for the mapping?
Modify the following code to create your graph:
