Reading layer `pinupalu' from data source
`/home/gkandlikar@lsu.edu/gklab/talks/img/pinupalu.shp' using driver `ESRI Shapefile'
Simple feature collection with 38 features and 5 fields
Geometry type: POLYGON
Dimension: XY
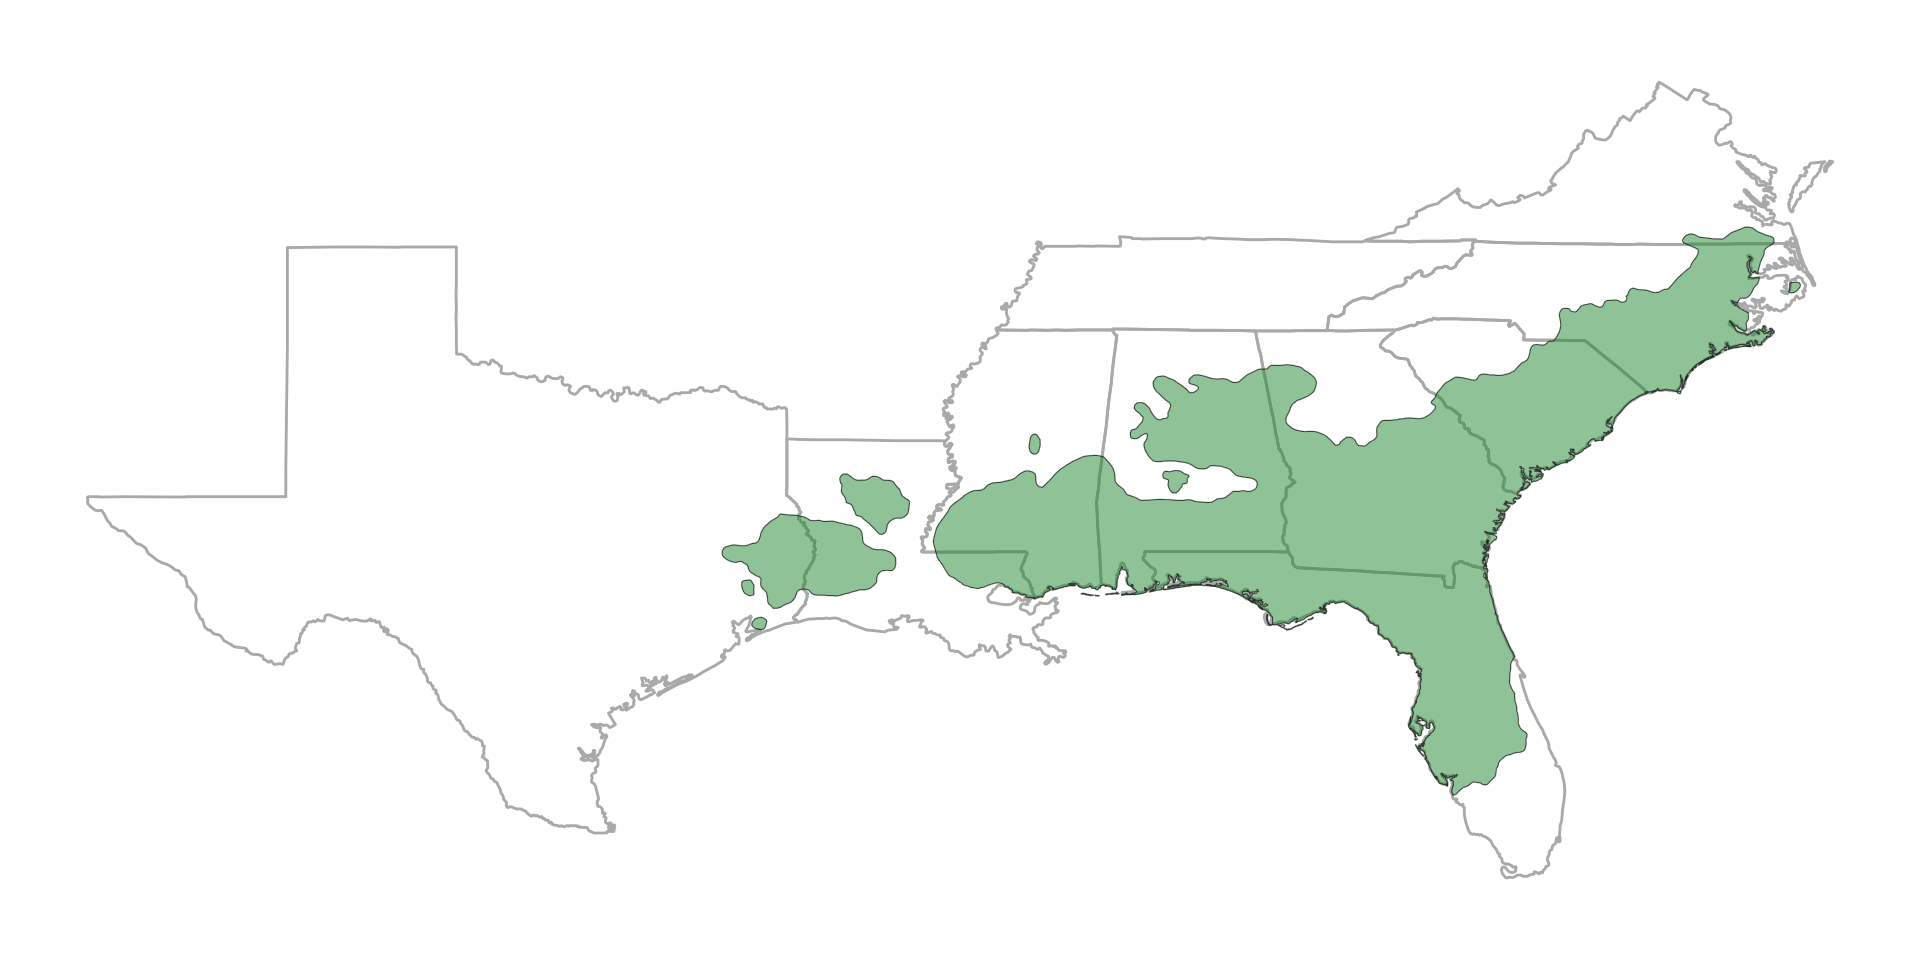
Bounding box: xmin: -95.21806 ymin: 26.61921 xmax: -75.79999 ymax: 36.84856
CRS: NACode
# States we want to show
llp_states <- c("texas", "louisiana","mississippi", "alabama", "florida", "georgia", "south carolina", "north carolina", "virginia", "tennessee")
states <- map_data("state") |>
  filter(region %in% llp_states)

ggplot() +
  geom_polygon(data = states,
               aes(x = long, y = lat, group = group), fill = "transparent", color = 'darkgrey') +
  geom_sf(data = little, fill = alpha('#228833', 0.5)) +
  theme_void()